Map Maker 5 course
Appendix
A1 Key and crucial concepts in a nutshell
BASE-MAP
- To make a map we need a base layer. This is usually a map which we buy or download from somewhere or it can also be e.g. aerial photography. Alternatively, open a previously produced map. Either way, as soon as a first set of data is on screen to start a new project, save it with a new name.
MAP OBJECTS
- Maps are made up of only 4 types of map objects: polygons; lines; texts and points (symbols). We find buttons to draw these objects in the TOOL BOX (bottom left of the screen).
STYLE FILE
- We draw ‘raw’ vector data and allocate a style number to each map object. This style number corresponds to a style entry in the style file. (Shortcut: F2) The style editor offers an impressive range of style changes, from different fonts, colours and fills to even creating custom symbols.
LAYERS
- We draw our map objects on top of that Base-map. All this is done in the ‘live layer’.
- If we want to change any appearance settings (labels etc.) whilst drawing, we can find these in the LIVE LAYER header on the left.
- We need to save our drawing by giving it a name (and we prefer to add a version number) and we need to save this new file into a folder.
- Once a layer is saved, it becomes a ‘passive layer’ and is shown in the PASSIVE LAYER header. Any change to how it looks and behaves (e.g. which labels are shown) can be adjusted in menus which open by clicking on the little blue arrow on that layer, in particular the option layer properties.
- As our work progresses we will create and stack more and more layers onto the Base-map.
PROJECTS
- Our total map consists of separate components (base layer, passive layers, live layer, data and style file etc.). Each component can be saved separately. Together they make up the ‘map’ which we want to publish. We can re-use any of these components in other map productions.
- For convenience sake, we can ask MM5 to make a ‘shopping list’, to write a list of used components and all the associated settings. MM5 calls this list a ‘Project’. This means that when we open a project file, MM5 will read this list and serve up all the components of the total ‘package’ exactly the way we left them at the moment we saved our project. And so we tend to think that the ‘Project’ is the map, but in fact the individual layers are the more important aspect of this map (e.g. to exchange - export - data with other interested parties). The ‘Project’ file is only the shopping list (a simple *.txt file).
- The sequence in which these layers are stacked can be important, and will change as we are working on the map.
- Any change in the map can be saved by saving the project (Shortcut: F1).
- When we want to update any information in one of the passive (vector) layers we need to ‘copy’ this layer to the ‘live layer’ (a setting which can be found under that little blue arrow).
It is important to realise what the menu tells us ‘copy this layer to the live layer’. This means that our initial file remains on file, we are working in a copy. It is only when we save it again (with the same name) that we are overwriting the original. And when we stick to our preferred way of saving layers; i.e. with a version number, it means we cannot lose any work and we can step back a few versions when needed.
- The live layer always lives on top of the stack (because, just like in the paper world, otherwise we could not draw on it). This means the layer sequence can change as we progress, and we need to reshuffle them before we go to print to get the right cartographic effects.
PUBLISHING
- We draw maps in the Map tab and we print out our map or save it as an image or PDF file through the menus found in the Page tab.
- We can design an advanced template which we can save separately and re-use for other projects.
A2 New map STEP-BY-STEP
Principles involved:
- 1.Get a first map layer, aerial photograph or previously produced project on screen as a map backdrop.
- 2.Save this project with a new name
- 3.Create a style set
- 4.Start drawing, and frequently: Save your project.
- 5.Publish the map.
Step 1:
PROJECT header: Create a new project, Start project with file(s) of type...
or
Browse to the folder which stores a required map layer.
Filter out the file type, select the file and OK it.
Step 2:
Instantly after you have the first layer on screen, Save this new Project with a new name:
PROJECT header, Save this project, Save project as
Now that this new project has a name, from now on we can use the F1 shortcut key to save the project.
Step 3:
Create a style set.
PROJECT MANAGER, STYLES, Edit the project style set.
Once all styles need are created, close the menu down and press F1 to save the project.
Step 4:
We can only draw or edit in the ‘live layer’
The moment we start drawing a polygon, line, symbol or text: MM will have created a new live layer.
If you want to press on with a previous layer or update a layer already in this Project you need to copy that into the live layer. THIS IS IMPORTANT TO REMEMBER!
- a)After having drawn for a bit (a few minutes or a few lines & polygons), save your live layer (with increased version number), save project. (F1)
- b)Press on with drawing (i.e. copy the layer back into the live layer).
- c)Tweak the project (layer sequence, styles and template to perfection.
Loop procedure step 4 until the map is ready.
Step 5:
Once the map is ready, go to the Page tab and print the map or save the map to e.g. a PDF.
A3 Glitches in software
We all like to have software that just works. But ‘glitches’ in software seem to be unavoidable. Software, by its very nature, is based on extremely complex programming and lots can go wrong.
Some examples: MS Windows issues updates each month and those are not only to install additional functionality, these updates include ‘patches’ to fix glitches. Our version of MS Word freezes on us periodically. The printer driver software of one of the most prominent printer manufacturers has glitches. A while ago we noticed ArcView did not show a normal aerial photograph well on screen, QGIS has got glitches. And this list goes on.
Usually such glitches are not ‘life threatening’ or ‘show stoppers’. It is always beneficial to report glitches to the developers.
Ironically, it would almost seem that the larger the company is, or the larger the ‘supporting’ community is which develops the software, the longer it takes to get a fix for a glitch.
Unlike a package such as MS Word which deals with limited data, GIS software interacts with many different file formats. The variety of file formats increases the likelihood of glitches.
Glitch Protocol
When one experiences odd behaviour in software, to narrow down the fault, a standard protocol is this:
- 1.Try it again.
(it could be user error)
- 2.If it persists, try it again but on a different file, a different project, different data.
(it could be that in the current data set, things are somehow corrupt or off beat)
- 3.If it persists, close the software down and try it again.
(it could be that the software is simply in a twist and that this mishap is a temporary phenomenon)
- 4.If it persists, reboot the computer and try it again.
(it could be your computer is in a twist and a reboot might reset things)
- 5.If it persists, try it (if possible) on a different computer or ask a colleague to try it.
(it could be your computer e.g. it needs a later Windows instalment).
- 6.If the error persists: download and install the latest version of that software when possible.
(it could be that this glitch has been reported by others and that it already has been fixed in the latest version.)
- 7.If the error persists even after installing this latest version and all of the above tests have been tried: report the glitch to the developers and try to be as specific as possible explaining the exact steps which lead up to the glitch.
These are software independent observations and this is a solid general protocol. It is equally applicable for the Map Maker 5 software.
A4 Where to find or buy map data
There is a lot of map data available on the internet which can be accessed or downloaded.
Paid for data can be ordered on-line and can be downloaded within minutes. A lot of governmental organisations share some of their data for free. Even commercial organisations offer free map data. Companies like Google, Bing and ESRI (ArcGIS) also host a web service with useful data e.g. worldwide aerial/satellite imagery.
Then there is for example the impressive Open Street Map initiative. This is a dataset produced by volunteers using their hobby GPS kit and Bing aerial photography to create an interesting world covering topographic map which can be made use of in various beautiful lay-outs. In some urban areas the information collected rivals (if not surpasses) that of National Mapping Agencies. There is even talk of such agencies incorporating this data into their data sets! Naturally accuracy and reliability of such data is an issue. But there you have it, a blurring of free and paid for data.
The fact that modern mapping/GIS software offers access to such datasets does not mean the user can use it for whatever purpose. All this data is copyright protected (even the free Open Street Map data). The Bing aerial photography can only be used in a professional way to feed the Open Street Map project. The aerial/satellite photography of Google and ArcGIS is governed by very strict terms of use. The onus is on the user and not the mapping/GIS software provider to adhere to these copyrights and these terms.
It is tempting to open up for example free satellite imagery and just make use of it as you sees fit. But beware, it is like a jewellers displaying their jewels on a table in front of their shop window on the pavement. Unattended, with a big advertising sign: “FREE JEWELS” and a subtitle “Feel free to touch and look”. And then in tiny print which can only be read with a magnifying glass: “ask inside for assistance” . The jeweller expects us to pop inside, ask for the copyright statements and terms of use. Which clearly states that the diamonds may only be looked at, and may only be handled with gloves, and only in the presence of the jeweller. How on earth could you ever have thought to take home a diamond off that table… Not so long ago this would have been called ‘incitement to theft’, but in this fast changing world this seems quite acceptable.
Also, try to find out the date the data was captured/collected: a key element in serious map making. Free aerial photography is usually out of date.
In short: it is essential to know where the data comes from, its date and its allowed use. Always include copyright statements to ward off the first round of potential legal claims against you!
Add free base layers in MM5
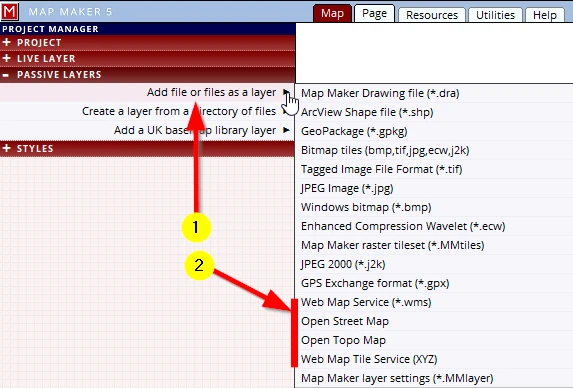
MM5 offers quick access to free online data:
(1) In the PASSIVE LAYER header, select Add file or files as a layer
(2) Select one of these options e.g. Open Street Map
It is recommended to only try this on a small project areas first, if you have got the entire country in view it takes very long to download all that free data!
Once the data is on screen note the copyright warning in the bottom left of your MAP view, as well as the copyright statement in the PAGE template.
Note: please bear in mind when testing this in combination with our course data, that although our course data is in Scotland, it is in fact a fictitious Base-map!
Note: a PDF file with hyperlinks to the websites mentioned in this Appendix can be found in the ‘Available map data’ folder; Links.pdf
Free UK data
The Ordnance Survey used to be a governmental organisation but a few decades ago effectively became a commercial enterprise. That meant that taxpayers who now wanted to use maps and map data which they had funded through tax have to pay for it again. And once all became digital, the end user is now charged annual licence fees on top of that.
Under pressure from various organisation the OS was forced to release data into the public domain. They cleverly released quite a lot of data but not the highly detailed map data most land managers need. Still, it is a good beginning.
It is truly impressive how accessible and fast their web-services and new file formats work.
Note: The base map we use in this course is a fictional map but is located in Scotland, overlaying any of the below mentioned free map layers onto our fictional map will result of course in a nonsensical comparison!
1. OS web server
This dataset can be accessed through the OS Web servers. It is fast and has different ‘zoom levels’ which are interesting to use as location maps. This dataset does not show all the detail which the Map Maker processed downloadable version has but the advantage is that the entire UK can be loaded as a single layer. The file format developed for this is superfast, but all depends on the speed of your broadband.
It can be introduced as a layer here:
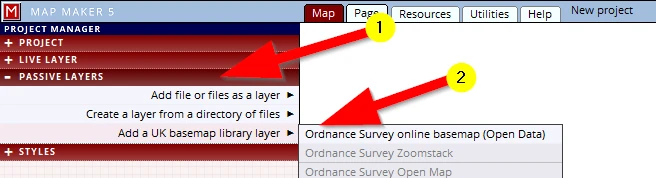
Note: This menu option is by default only visible in the interface for UK users, a change in the system settings can be made so that international users can also have access to this data should there be a need to.
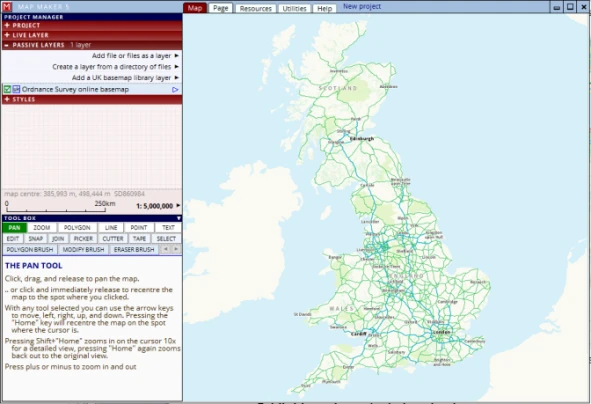
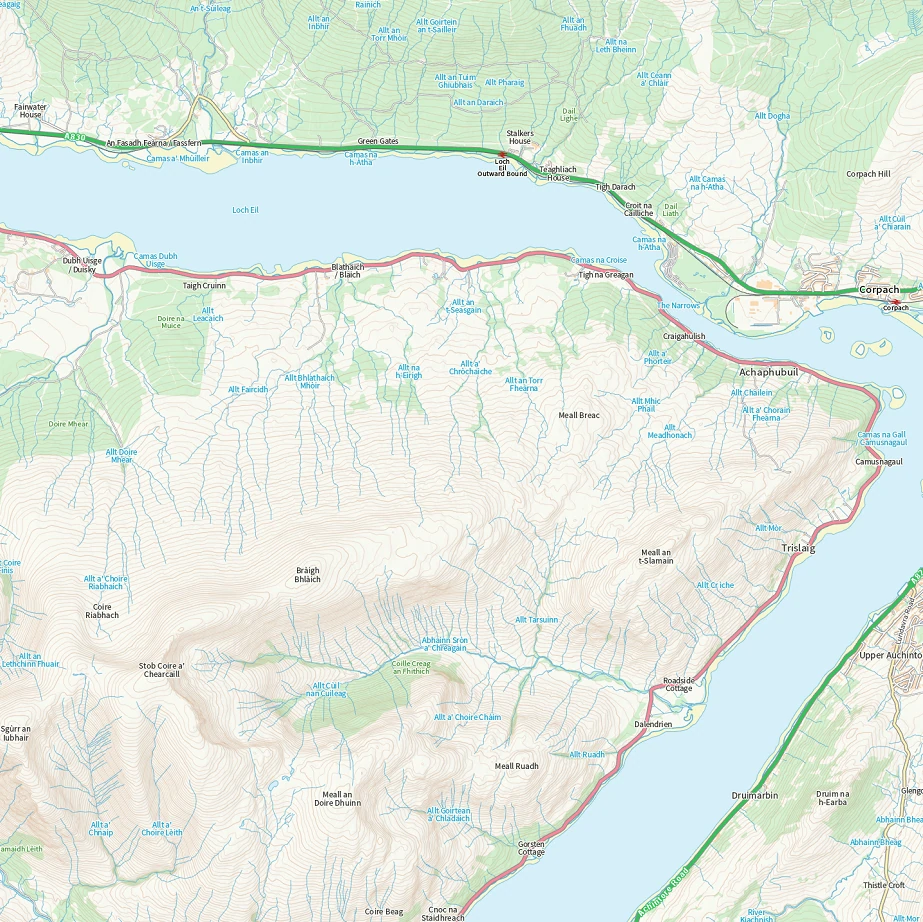
This dataset too, is ‘raster’ data, in other words, these are just ‘images’. With every zoom, a new set of tiles will have to be downloaded. At about 1:6,000 scale the maps start pixelating.
Note: please bear in mind when testing this in combination with our course data, that although our course data is in Scotland, it is in fact a fictitious Base-map!
2. OS Open Zoomstack download
The above mentioned maps are raster data, but these were created from ‘vector’ data. And as we have learned, ‘vector data’ can have attribute data - we can style it and work with it. The OS also offers this vector data in one single file (11Gb!) which can be downloaded from here:
https://www.ordnancesurvey.co.uk/business-government/products/open-zoomstack
Once unzipped we can add relevant map data (which is served up in different layers) into map maker.
This file can be added as a normal vector layer. Browse to the folder where it was saved, filter out the file type ‘GeoPackage’ (*.gpkg).
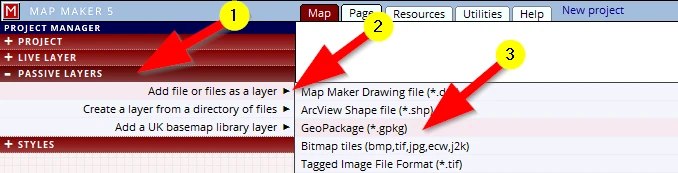
It is prudent to first zoom into your project area before activating any of the vector layers - it will reduce the waiting time for all the data to load.
We need to create styles for each layer, but it is vector data, which means we can get it into the live layer as well through the selection tool (SELECT, ACTIONS, Copy selection to the live layer).
3. Web Map Services & Web Map Tile services
Again the disclaimer: it is beyond the scope of this beginners course, but we will point you in this direction nevertheless with only a few words:
Various institutes and organisations have a lot of map data which they happily share through their web servers. An industry standard exchange protocol was developed, and in MM5 we have the tools to make use of these services.
In Utilities we find the option Web Map Services (1-2). In it we can create a new *.wms file.
Here is an example of the UK ‘Forestry Commission’ (SF & FC):
https://ogc.nature.scot/geoserver/scottishforestry/ows?
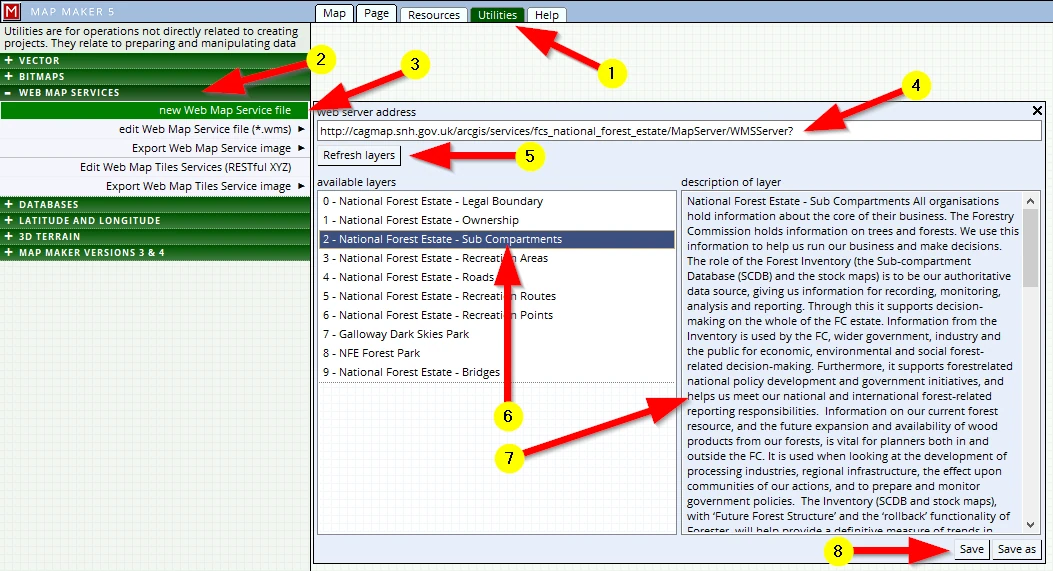
(3)Activate the option: new Web Map Service files
(4) (usually copy and paste) the given URL link into this command line
(5) Refresh layers
(6) Available layers will be listed (if the link is valid)
(7) An explanation of the content of this layer is often shown in this section
(8) Save this file
Back in Map view, in the PASSIVE LAYER header we can now add this *.wms file as a new layer and it will serve up the data hosted on their server. With this technology we can’t do anything with this data other than viewing it on screen in our map.
Web Map Tile Services are set up in a similar fashion (Edit Web Map Tile Services (RESTful XYZ). Google Aerial Photography and ESRI World Imagery data can be introduced as a layer in Map Maker 5. Although there are strict copyright and term of use involved these are still very interesting datasets.
http://mt0.google.com/vt/lyrs=s&hl=en&x={x}&y={y}&z={z}
Warning: this is an unofficial Google address. Check Google's terms of use before using it for work you publish or sell.
https://server.arcgisonline.com/ArcGIS/rest/services/World_Imagery/MapServer/tile/{Z}/{Y}/{X}.jpg
Warning: Esri allows free use of this imagery only for non-commercial work, with credit to Esri and its data providers. Check Esri's terms of use before using it for work you publish or sell.
Once these Web Map Serves have been set-up we can then introduce them as a passive layer:
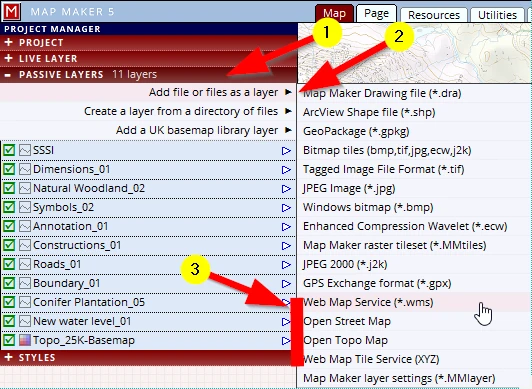
4. Governmental data
A lot of officially released ‘land management data’ can be sourced here:
England: https://magic.defra.gov.uk/
Scotland: https://gateway.snh.gov.uk/natural-spaces/wms.jsp
5. Google Earth
We recommend installing Google Earth. It is free, and Map Maker 5 offers a neat interaction with this software.
Whenever we have a map on screen and have taken care of our map projections we can view our work on the satellite imagery which Google Earth has on file.
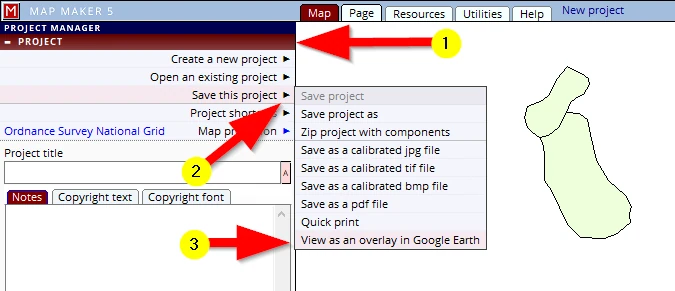
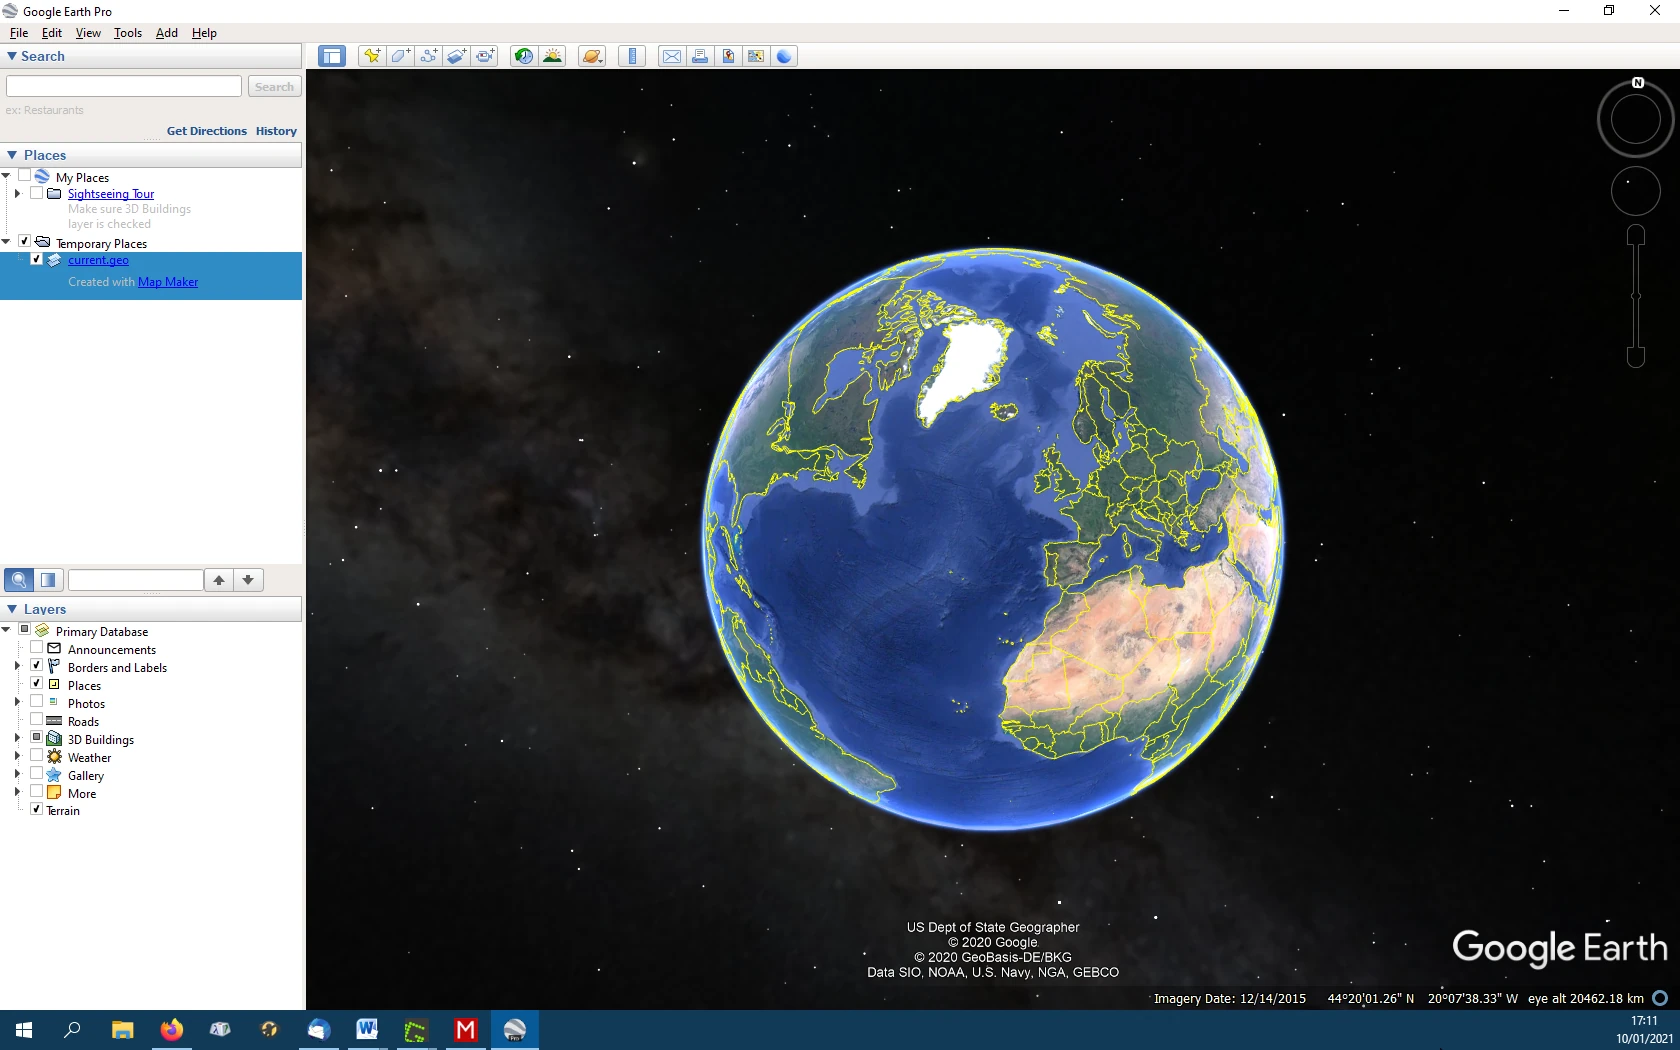
Google Earth will fire up and zoom in automatically to this area:
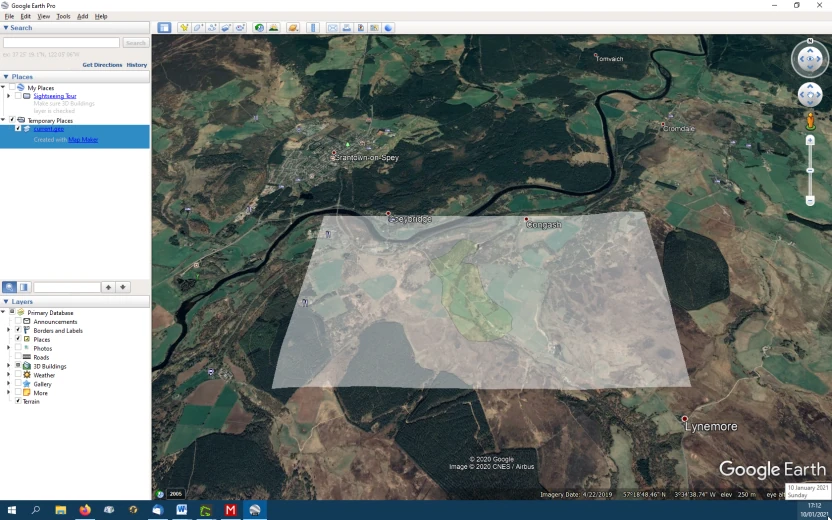
Pan or zoom in a little than tap the ‘u’ key on your keyboard. This will change the view from oblique to a vertical view. We can now turn our MM5 layer on and off and compare notes!
Purchase UK data
There are several Web map data shops. A Google search will serve up plenty.
These shop basically offer the same data through a very similar interface.
We can zoom into a map, draw a rectangle or specific shape, select the map data type we are interested in, see a price and put it in the basket and go to check-out.
Alternatively we can upload a SHP file which then defines the area to be purchased.
Some of these websites are more efficient the others. Their pricing is fairly similar but may vary per product.
The map products are usually the full OS map range, 3D data and various types of Remote Sensing data (Satellite imagery, LiDAR, aerial photography data).
When it comes to purchasing aerial photography data, do bear in mind that not all of these shops sell all available aerial photography.
Here are just a few suppliers (in alphabetical order). Our apologies to all those data providers which we have not listed here.
https://www.blueskymapshop.com/
Free World data
When you are after a simple overview map of the world in various projections, try this:
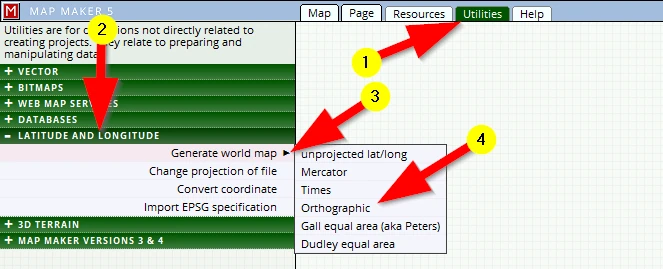
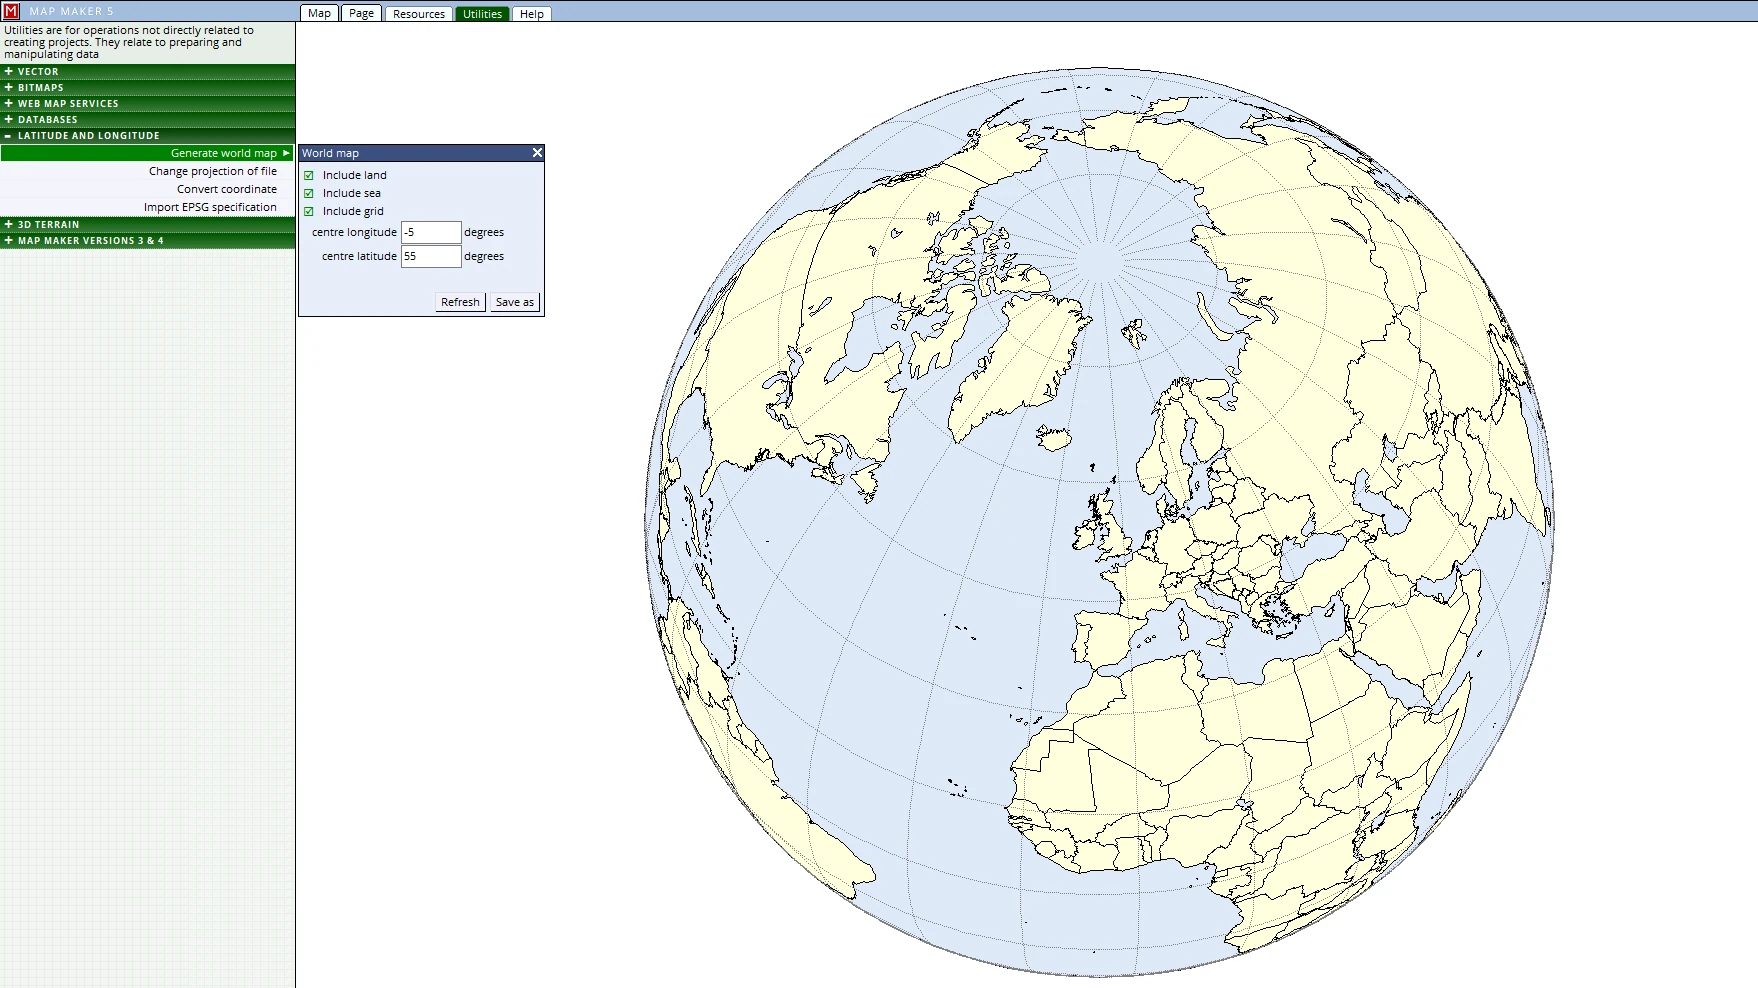
This is a link to a very useful index to data websites:
https://freegisdata.rtwilson.com/#home
A5 Setting up a map projection
All digital maps work within a standard mathematical 2D - X & Y coordinate system. Every country relates this standard grid to the earth’s 3D - Longitude and Latitude coordinate system. This relationship and conversion from 3D to 2D is defined in a so-called ‘map projection’. It is beyond the scope of this course to deal with any of that here.
The course material is situated in the UK and the default map projection for this software is set to the UK national grid. Setting up a specific map projection is not necessary provided no interaction is made with Longitude and Latitude coordinates (as when importing GPS data for example). For international followers of this course and those slightly more advanced and who do know about these matters and want to set up a specific national map projection, here is how to change that:
We can either change the map projection
- 1.in a project at hand (a one-off change)
or,
- 2.change the software’s default projection so that all new work is created within it.
1. A one-off change
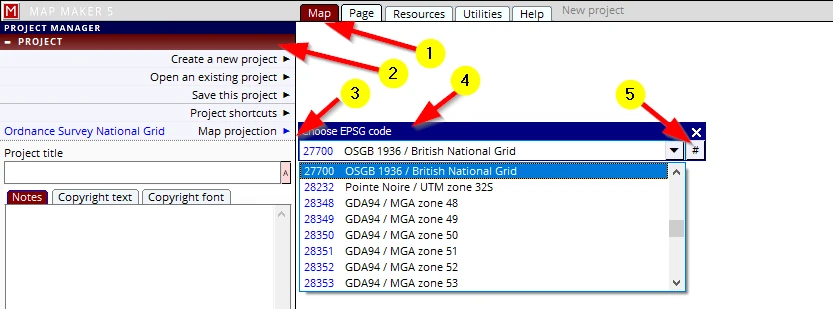
(1) Map tab, (2) PROJECT header, (3) Map projection
(4) Click on the option EPSG projections
A menu will open with a long list of all known EPSG projection codes, select the appropriate one, alternatively type in a known code (5)
(Try www. EPSG.io or do a Google search to find your specific EPSG projection code.)
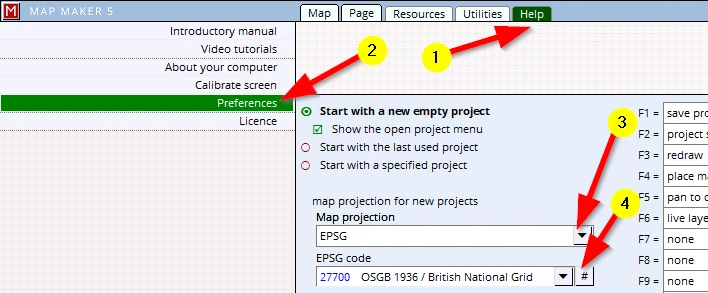
2. Change the software default projection