Session 3
Need to knows
Things might go wrong during this course. To help step back in the course, it is wise from now on, when prompted, to do the following at the start of a new Session:
- Open the project ‘My First Map’ (if not already on screen).
- Save this project as… and type in the following new name: ‘My first map-Session 3’.
If, or rather, when things go wrong, it will be quicker to step back to this point.
4 A word on FILE TYPES and FORMATS
4.1 Raster data & Vector data – the differences
There are several differences between Raster and Vector data:
First difference:
The first is an obvious difference:
Raster data is defined by its size on the ground, vector data is a mathematical line between two XY points and thus is, by-default, a thin crisp line.
(Through the style-set we can also define our vector data dimensions to meters on the ground as opposed to mm on paper, but that is only the ‘styling’ of the raw vector data.)
Second difference:
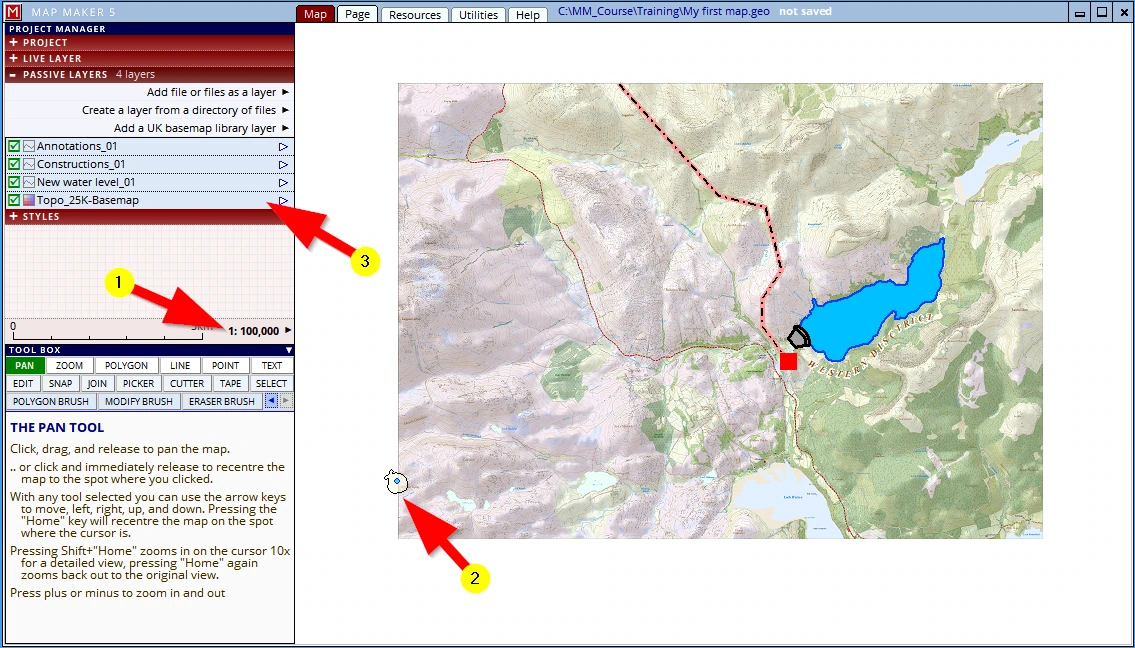
(1) Please zoom back out to e.g. 1:100,000
(2) We can see the vector polygon brush we drew. We can see it is a ‘live layer’ because it has the little blue ‘live layer dot’ in the centre of it.
(3) We have four other layers on screen and the base layer. This base layer is a ‘raster’ file and is at the bottom of the stack. Please click on this layer header, hold and drag it to the top of the stack.
(1) The Base-map is now on top of the passive layer stack.
(2) Naturally the live layer, will remain on top of it all, otherwise we could not draw on it
(3) All the other layers are not visible anymore, because they are under the raster layer which is on top of them.
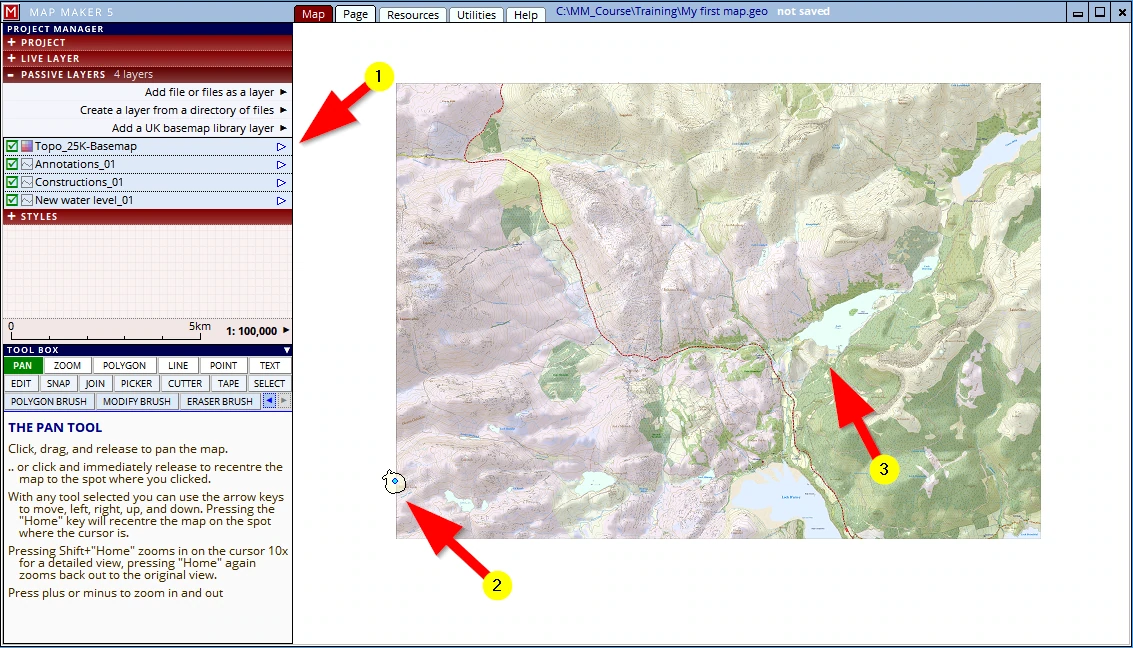
It is like in the paper world. Working with transparencies and layers, pull the paper Base-map out and put it on top and the other layers will disappear from view.
And whilst we are at this, try the following:
Click on the little arrow to the left of the layer, then select layer properties

(1) A new menu will open on the Visibility header
(2) and below it, sure enough, there is a tick box to ‘Hide layer’, which is repeated by a tickbox before the layer name
(3) Slide the opacity slider to about 75%
(4) and see that the ‘solid’, opaque raster layer now becomes transparent!
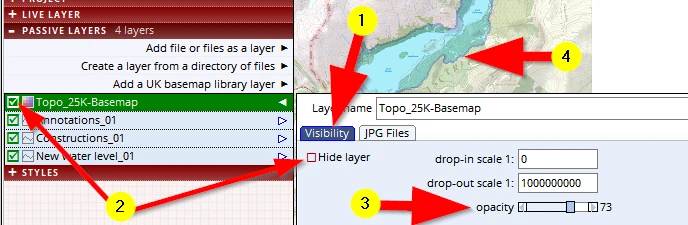
This now is a second difference between a ‘raster’ layer and a ‘vector’ layer:
raster files are by default ‘opaque’.
Third difference:
A third important aspect to remember has to do with the volume of data involved.
In this case the raster file is a Base-map, but it could also have been an aerial photograph - those too are ‘raster files’. The actual file contains information where each pixel must be displayed on screen (these X&Y coordinates), and also what colour each pixel should have (which is defined by three principal colours: Red, Green and Blue. That is a lot to record. A large raster file can have millions of pixels. As a result you will find that raster files often are very big. Computer storage capacity nowadays is hardly an issue, but still it is a thing to consider. However, more importantly, your computer needs to read all the information of each pixel before it can display it on screen. And this will take time. The faster your computer, the faster a raster file can be displayed on screen.
On the other hand we have ‘vector data’,
Try the following:
Activate the polygon tool and draw any odd shape.
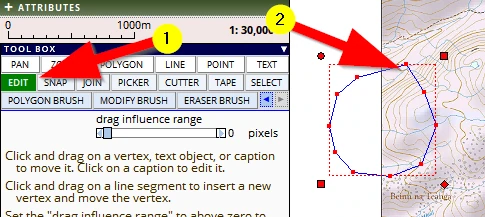
(1) Activate the EDIT tool
(2) Click twice in the new polygon (but not on the blue dot) and you will see it changes into so-call ‘Edit Mode’
We can now see the ‘raw’ line-work which the computer has recorded. Each click you gave is a point recorded in X&Y and the software defines the line between them. This is minimal data to process for a computer. And because of the nature (and size) of a vector file, your computer will work very fast with this type of data. And so this is a third main difference to remember:
Vector files are absolutely tiny compared to raster files and therefore take less storage space and work fast.
Fourth difference:
A fourth important difference to grasp is almost the most important one:
Raster data is like a (digital) photocopy of an original. Think of a paper copy - we cannot do much with it other than punch a few holes in it, write on it, fold it and file it. It is rather ‘dumb’ information.
Vector data on the other hand is mathematically defined data, and therefore:
- the software can interact with it. For example, mapping software can calculate the lengths of a drawn line or perimeter of a polygon (= handy e.g. to order fencing materials!). The software can calculate the Hectare covered by a polygon.
- And of course, we can change/edit the data (which is near impossible with paper maps).
- Each map object we draw will have an automated sequence number, or, we can give it a specific ID so that we can keep track of each individual object.
- Not only that, vector data can record other information as well. We have done it a few times already: after each map object which we drew, we assigned a ‘style number’ to this object, and that style number was used to ‘render’ the object (gave it its colour); when we used the ‘text’ tool we also typed in a specific name. In fact we can give any map object a ‘name’ (in jargon: a ‘caption’, or ‘label’).
This is so-called ‘attribute data’. When using the edit tool we can see a dedicated header in the green interface, ATTRIBUTES which deals with this type of advanced use. For example:
Trees: Species; Health; Risk; Girth width; Height etc.
Fields: Reference numbers; Crop; Rotation planning etc.
Buildings: Address; Telephone numbers; Type of building; Tenant name etc.
So, in short, when we draw a map object the computer records all sorts of interesting things automatically and we can add all sorts of specific additional data to it.
The bottom line to remember is this:
Raster data is ‘a one-trick pony’, vector data opens the door to very intelligent, efficient and practical use.
4.2 What are ‘File extensions’?
And whilst we are talking about file types, the following is also important to know. Unlike software packages like Word or Excel, when working with a GIS it is inevitable we also have to learn a bit about the ‘file extensions’.
A ‘file extension’ is like the family name of a person.
Take for example: the name ‘Jo Bloggs’.
What does this name tell us?
Well, the first bit, ‘Jo’, is the given name by the creators (parents) of this file. Jo has seen a bit of life and had some work done over the years - a new hip, knee and shoulder- those who have worked with Jo now know Jo as ‘Jo_4’ (Jo version 4).
In short, the first part of a file name does not tell us much, it is just a given name (with or without version numbers).
The last part of the name, ‘Bloggs’ is of more interest.
This tells us that ‘Jo’ belongs to the ‘Bloggs’ family. Phew, and don’t we all know what the Bloggs family can do and are up to! They are known far and wide and have a reputation, positive or negative. We’ll stay clear of that because we don’t want any trouble with the Bloggs family.
In digital speak this translates to a file name like: Jo_4.Bloggs.
Well now, ‘Bloggs’ is the ‘file extension’, and that tells us what type of file it is and often in what software package it is made.
Again, unlike Word or Excel which only basically work with one native file format, in digital map making/GIS we need to work with all sorts of file formats.
And not just a few …
We have seen this already in action:
… we have used a raster file *.jpg, we have created a few drawings (*.dra) we have saved our project *.geo, and later in the template we will use an *.rtf and even a MS Word document *.docx (which is the latest version, the older version was called *.doc.) and we can save the map as a *.pdf.
And that is not the end of it: MM5 can use GPS data *.gpx, we can work with MS Excel spreadsheets (*.xlsx) and other databases *.dbf. We can import map data from other packages through the main international file format ArcView ‘SHAPE ‘ files. It is important to realise that such a one ArcView vector map layer, comes in as a triplet of files: *.dbf, *.shp and *.shx, and if we include the projections data *.prj, it is four files to represent the one layer... And then we shall not mention that MM5 can also work with web-maps (*.wms) or can superimpose our map in Google Earth and use those files (*.kml) as well.
And then a few more. That is all standard GIS talk, not MM5 specific.
… Pffff, headache anyone?
The good news is that these things will grow on us quite naturally once we work with things and there is little we really actually have to learn and remember since MM5 will guide us elegantly through these things.
4.3 Increasing the functionality of Windows File Explorer
There are two settings we would recommend changing in Windows to make our GIS life easier.
Dealing with files we often make use of ‘Windows Explorer’, also-called ‘File Explorer’.
Windows usually hides the file extension when browsing for files because with packages like Word or Excel we just open the software and open the file we want to work with and thus the file extensions are deemed not relevant.
There is a setting which we can change so that from then on Windows will show the file extensions as well. And this is useful when we use Windows Explorer to clean up folders or look for specific files.
The setting which does this can be found here:
Open Windows Explorer through the usual menus or by pressing the Windows logo key on your keyboard together with the letter ‘E’.
It opens probably something like this:
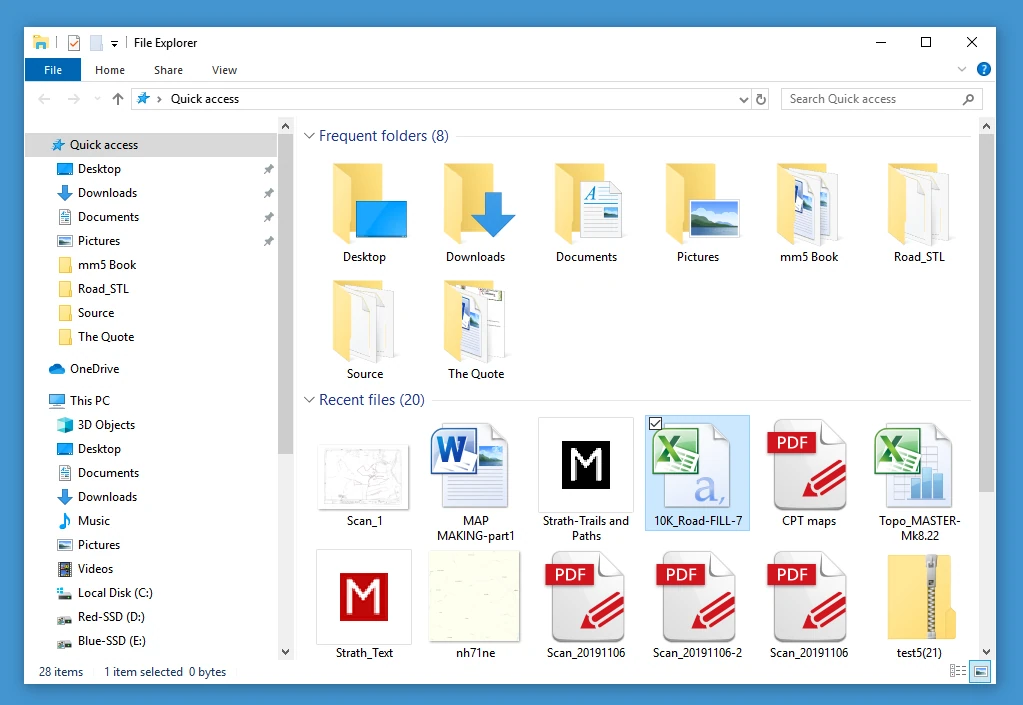
In this typical example it opened on the ‘Frequent folders’ list and below it the ‘Recent files’ list, and in this list the files are shown as an icon (with their given names). Some logos inform us what software package will open them (Like Word, Excel PDF etc.) but not much else is shown. Note: IN Windows 11 it is found under: View → Show → File name extensions.
Show details
Word and Excel files are seldom very big and so by default the file sizes also are not shown. As explained above, file sizes of Raster files can be huge and can soon clog up your computer, so the first thing we recommend would be to change this display to show the details of each file, not these icons
This can be done by clicking on this icon, here in the bottom right:
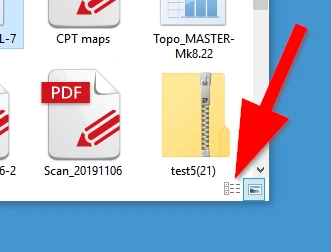
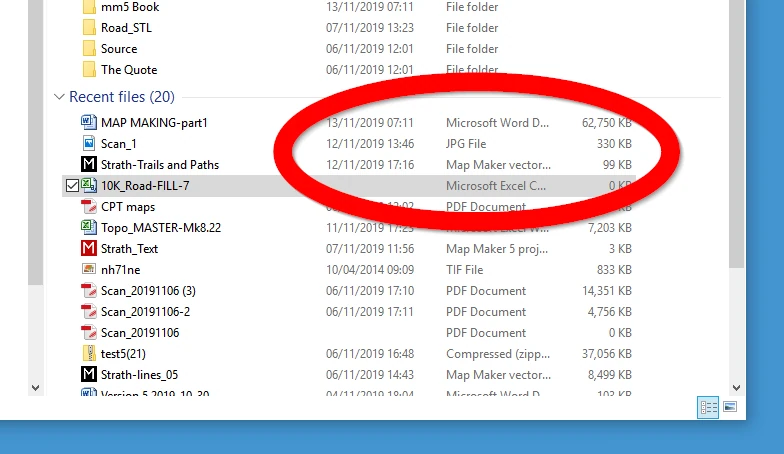
The interface changes to show additional and most useful information, like the date, File type and File size.
From now on the display will look like this:
Show file extension
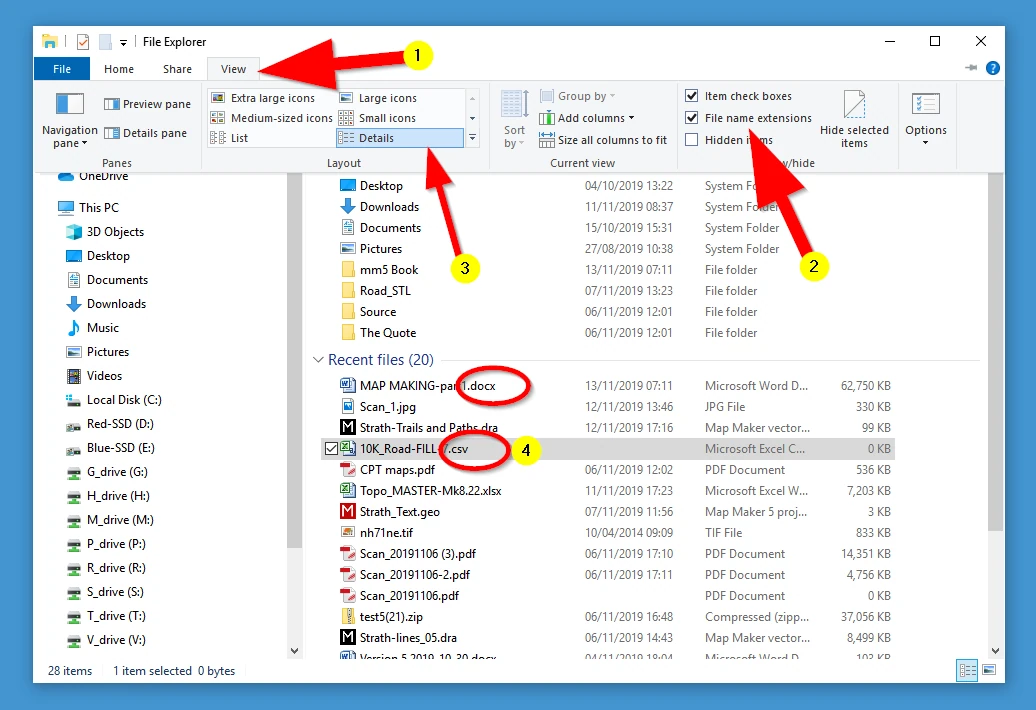
Although the software which will open these files is listed with the above setting, we also recommend changing the following setting:
(1) Click on View
(2) Check the box File name extensions
(3) Note that the icon/details can also be changed here
(4) We now see the file extension and the default package it will use to open the file. In this case for example, the file 10K_Road-FILL.csv (whatever that file may be) will be opened by Excel, but the file extension tells us it is a *.csv file. When we are progressing in computer/GIS/map-making work this is useful information to know.
Anyway, these Windows interface tweaks are personal preferences, you may not need them at first and/or not like them.