Session 8
Legends & location map
If your project is not on screen anymore, please open it (‘My first map –session 7), go to the PROJECT header and save this project as: ‘My first map-session 8’
12 LEGENDS
Most thematic maps need a legend, i.e. a key to explain what the map objects represent. The legend is made from a style set. Many professionals use the same style set for different clients, so the legend can often also be re-used. For this reason the creation of the legend can be found under the tab: Resources.
The creation of the legend is often one of the last few things done to complete the map because, during the process of map making, styles will often change and only in the last stage before printing things are tweaked to perfection.
We are currently in the Page tab, ready to slot in the legend box. And although we have not created a legend yet (in the Resources tab) in this Page view, when we add a legend box MM5 offers a shortcut which takes us to the Resources tab, the legend creation menu.
Click on Add new box, select legend and see that the interface has changed to deal with legends.
(1) Here you can choose a previously saved legend or
(2) you can create a new legend by clicking on the button Go to legend file editor.
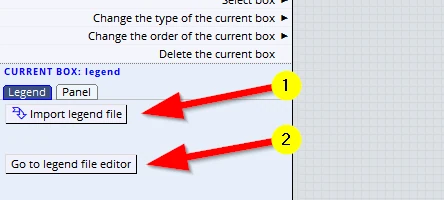
Click on the button: Go to legend file editor.
This brings us to the interface which deals with the creation of legends.
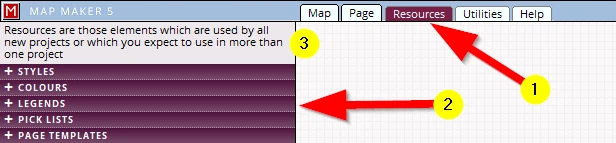
We could also have accessed it through the normal interface tab and headers:
(1) Resources
(2) LEGENDS
Note: the colour scheme of all headers is again different to those in the other headers.
(3) Note the explanation about this tab.
The creation of a legend works like this:
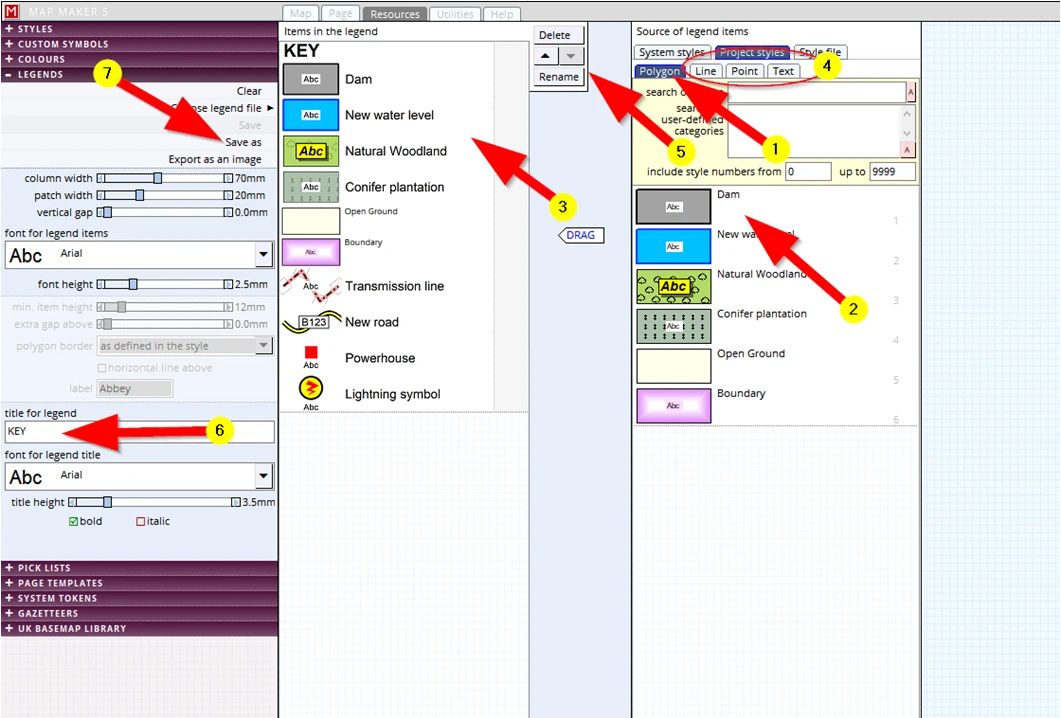
(1) As you know, to draw any map we only need 4 types of map objects: Polygons; Lines; Points and Texts. The appearance of these are defined in the style set. We will use these styles to create the legend.
The legend opens on the Polygon tab and shows all the polygon definitions made in the project style set.
(2) Select one (or better still, select all in one go: Shift & hold, select first & last) ...
(3) and drag it to the left panel
(4) Activate the Line tab and drag your lines across. Please do the same for Points and Texts
(5) Select one of the legend entries (3) and through these buttons (5) we can Delete a selected entry, move this entry up or down in this list or Rename the caption
Note that the legend description is the style name, so it is wise to take extra care in choosing the right names when creating the project style set: it will save time.
(6) Usually a legend has a title, e.g. ‘Legend’ or ‘Key’, which can be typed in and adjusted here.
(7) Once done, click on Save as and save it in our training folder with the title:
C:\MM_Course\Training\ My First Map_Legend
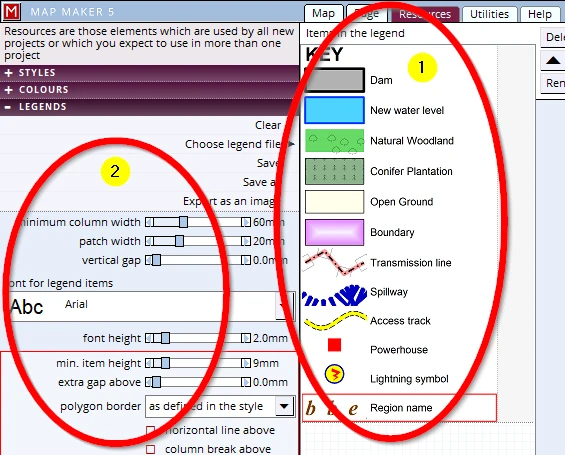
The full legend will look like this (1):
Note the options here (2), they offer us all sorts to adjust the width, height and spacing of the legend items and total width.
When we now go back into our Page tab we see the legend box and the saved legend now appears in that box.
In case you want to insert an existing legend, select the option:
(1) Import legend file, and browse to the training folder and select the legend we have just created.
(2) Resize the panel so it shows all the entries:
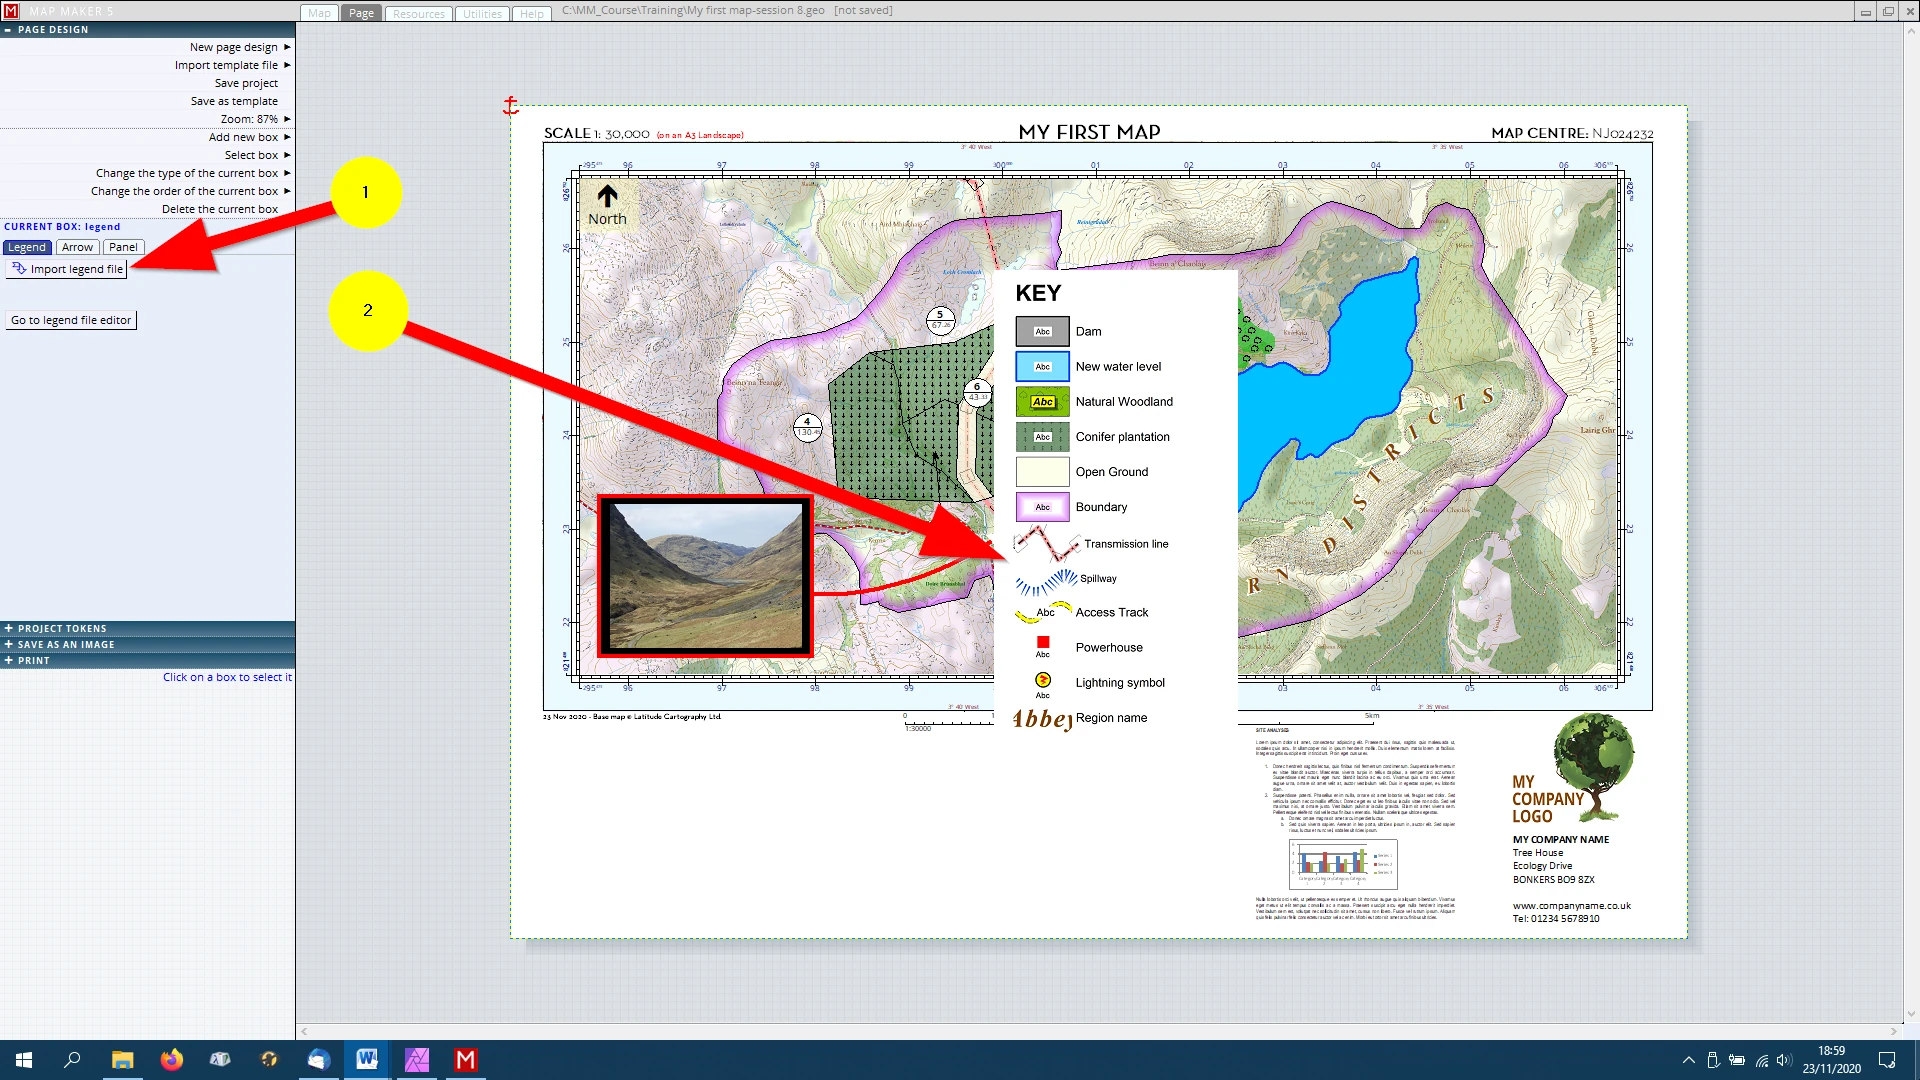
We can see that the legend is quite long and that we really do not have all that much space in the bottom half of the page. We could move the panel into the map frame but then it would obscure parts of the map. So we need to reduce its size.
We will tweak things a bit and split it up into two columns.
In our scenario the legend file was still on screen, if it is not showing click on the button:
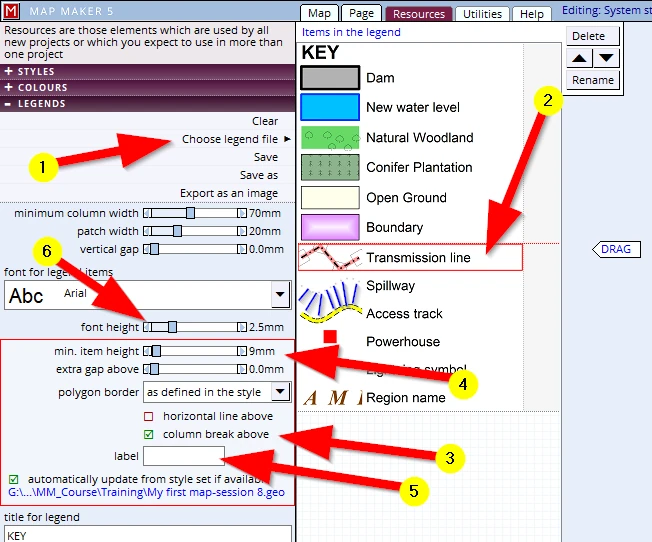
(1) Choose legend file and load the file we have just saved in the Training folder.
Once the legend is showing:
(2) Click on the entry: ‘Transmission line’
(3) Click on the option: column break above
Please toggle back to Page view and resize the box to make it wider, we can see the legend is now split into two columns.
Click on the first entry and Shift+Click on the last to select all
(4) Change the height of the legend patches to 10mm and ensure the ‘extra gap above is ‘0’
(5) We can delete the label letters Abc here to remove them from the legend item (this option is useful to type up the Ha for example of each entry).
(6) Change the font height to e.g. 2 mm
Save the legend: if you fail to save it, it will not have been updated in the Page view.
When we toggle back to Page view we can resize the legend box again in height and width to make a best fit. By default MM5 introduces quite a large ‘Internal margin’ which can be reduced to here (1) :
e.g. 1.5 mm
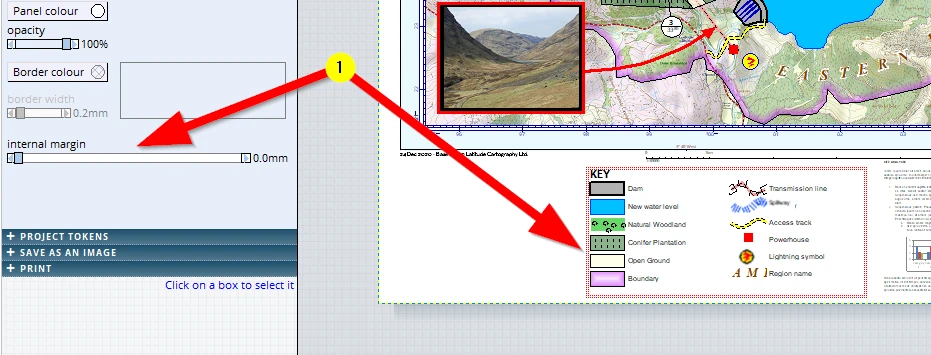
Make sure this legend panel is anchored to the bottom left
Our map is taking shape!
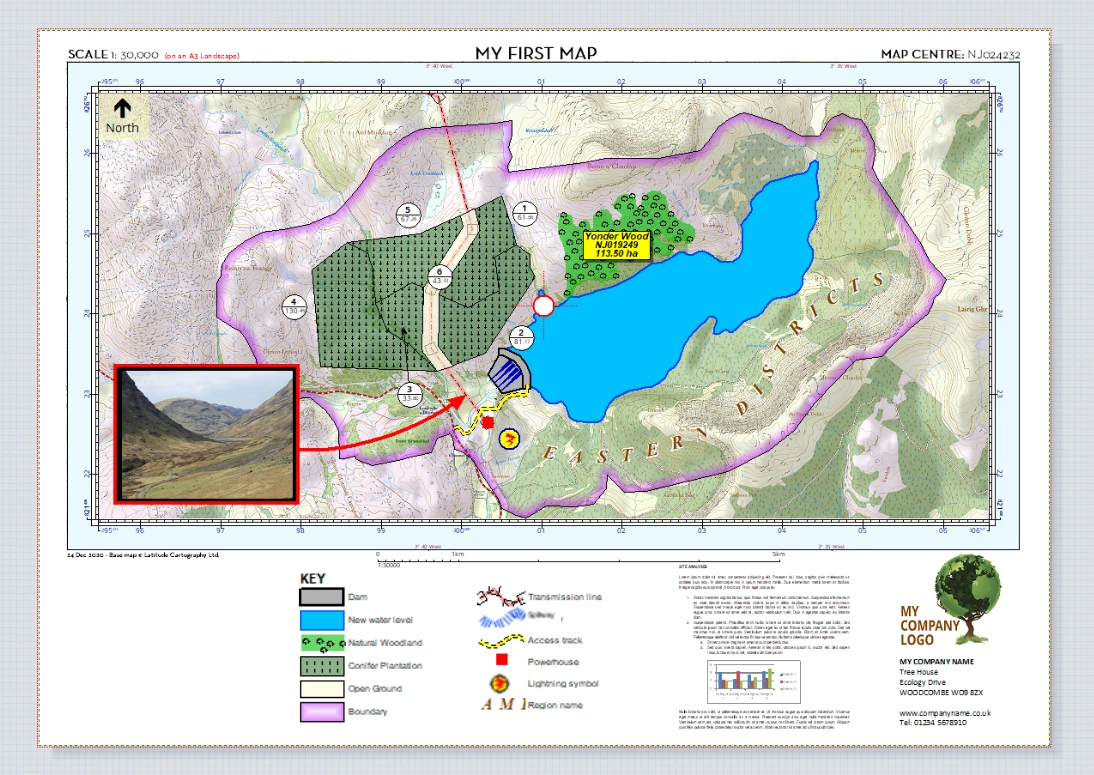
We like what we see: F1 to save the project.
13 LOCATION MAP
With maps like this it is good practice to include a location plan. We first need to whip one up! We will give two options to make one. The second one is particularly useful, spectacular even, for UK users.
13.1 Creation of a simple location plan – Personal data
Looking at the template it is clear this has to be a very small map. In the top right corner of the screen we can read in the X & Y ‘coordinates’ of the location of the cursor - in mm on paper- (1). By moving it into the place where the location map can go (2) we can get a feel how big the ‘paper size’ of it has got to be. We need to know that because we need to know roughly the scale we need to use for this map.
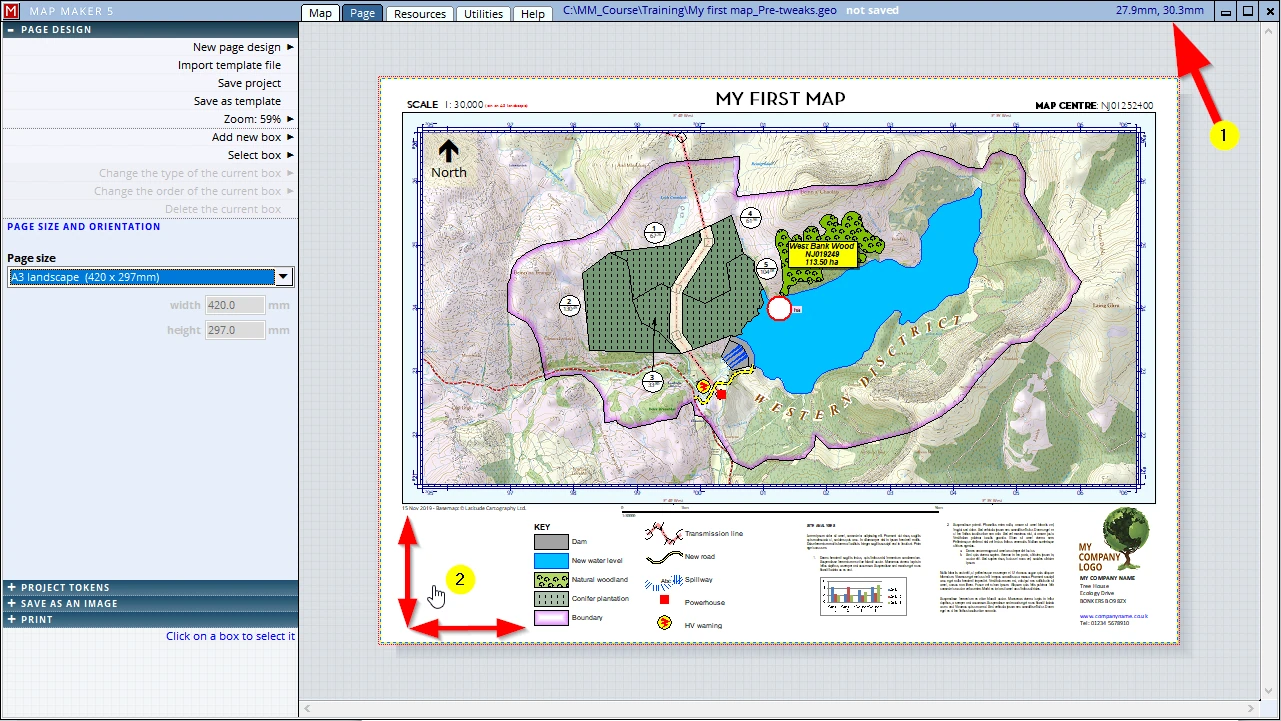
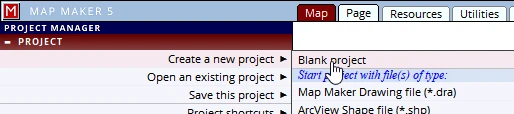
Now that we know the approx. size of this box (6 x 6cm) we are ready to make this location plan. We need to start a new project:
A location plan usually consists of a small-scale overview map showing a dot or symbol marking the location. As it happens, we have just got the right Base-map on file, which we must get on screen as a first layer in this new blank project.
We can add a layer in the PASSIVE LAYERS header: (1-2).
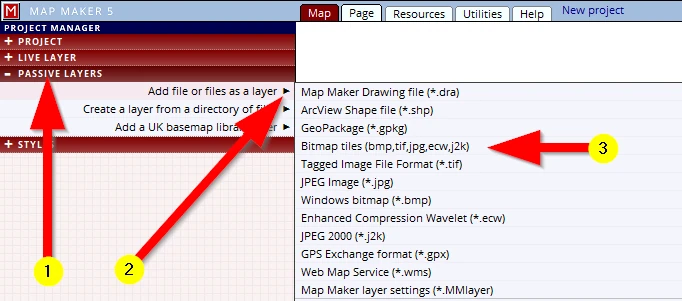
Looking at the list of possible file formats which we can use, we see that MM5 can open a good range of the most common and standard industry file formats - vector and raster.
We know that the layer which we have in mind is a raster layer, but we forgot what file type.
(3) The third option down is a generic ‘raster’ choice: Bitmap (bmp, tif, jpg,ecw,j2k)
When we now browse to the right folder, we recognise the file we are looking for:
C:\MM_Course\Available map data\UK_index map.tif
It will open like this:
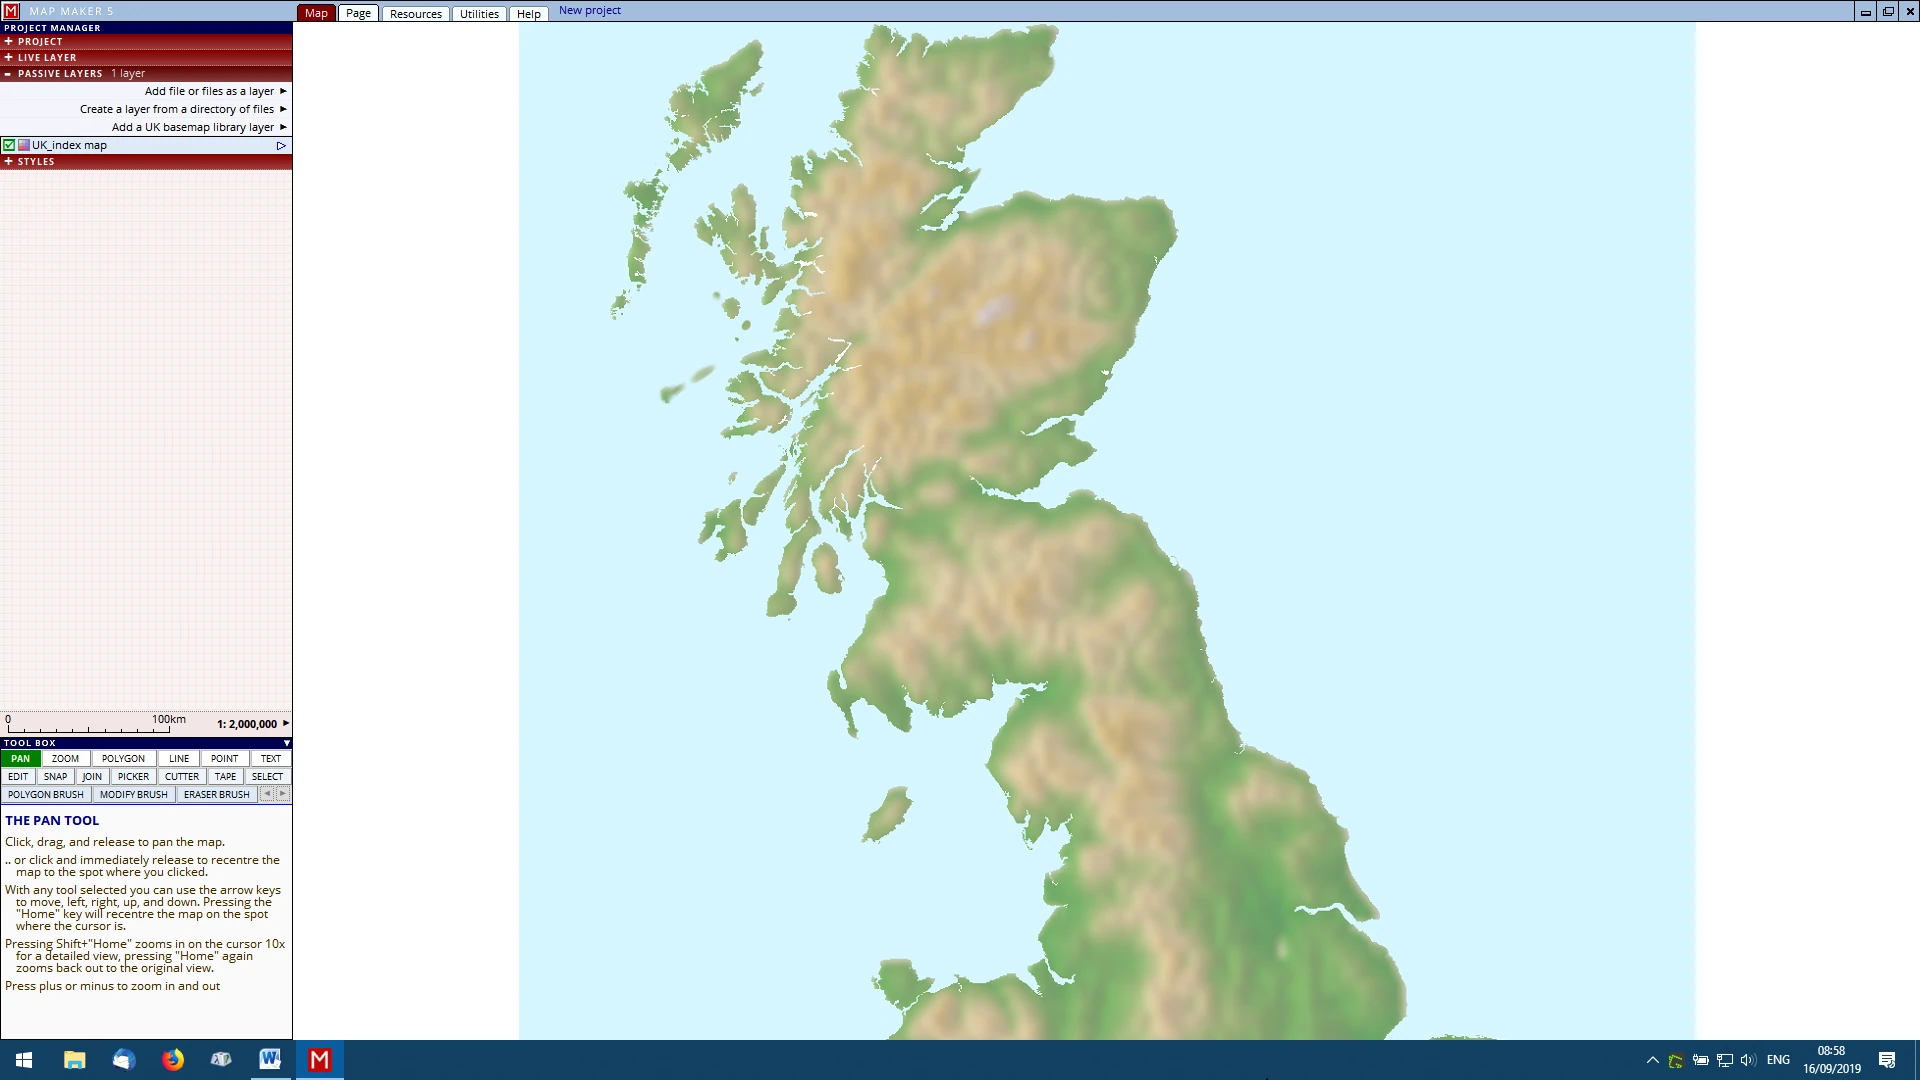
It is good practice to give a name to a project as soon as we have the first thing on screen.
In this case it is this first layer, but it could also have been an existing project which we want to re-use for a different map production. Whichever it is, get into this habit: the first thing to do is to save it with a specific name!
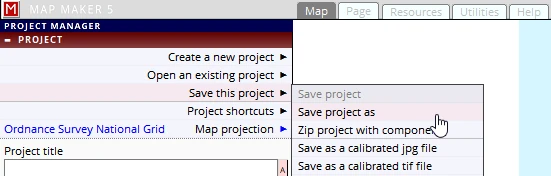
Pressing ‘F1’ will not do anything, because this is a new project and it is the first time we need to save our project so we must give it a name: PROJECT header, Save this project, Save project as, and call it ‘Location Map’ (save it in the Training folder).
You have been given the Base-map and might not know where our project area lives in the UK. We can find this out by adding the Base-map layer again:
Please add the layer:
C:\MM_Course\Available map data\Topo_25K-Base-map.jpg
It shows up here:
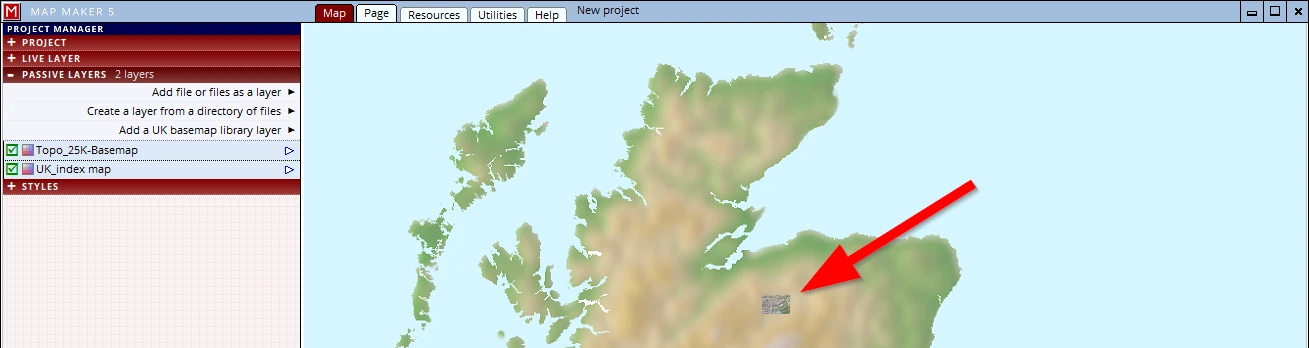
We know this location map should be about 6 x 6cm. Currently it is filling the screen.
A thing to remember is this:
The centre of the screen will show in the centre of the map box in the page template.
Map Maker 5 has a handy option to see exactly where the screen centre is:
(1) LIVE LAYER header
(2) Live layer properties
(3) Options tab
(4) Show centre location
(5) a red centre cross will now show.
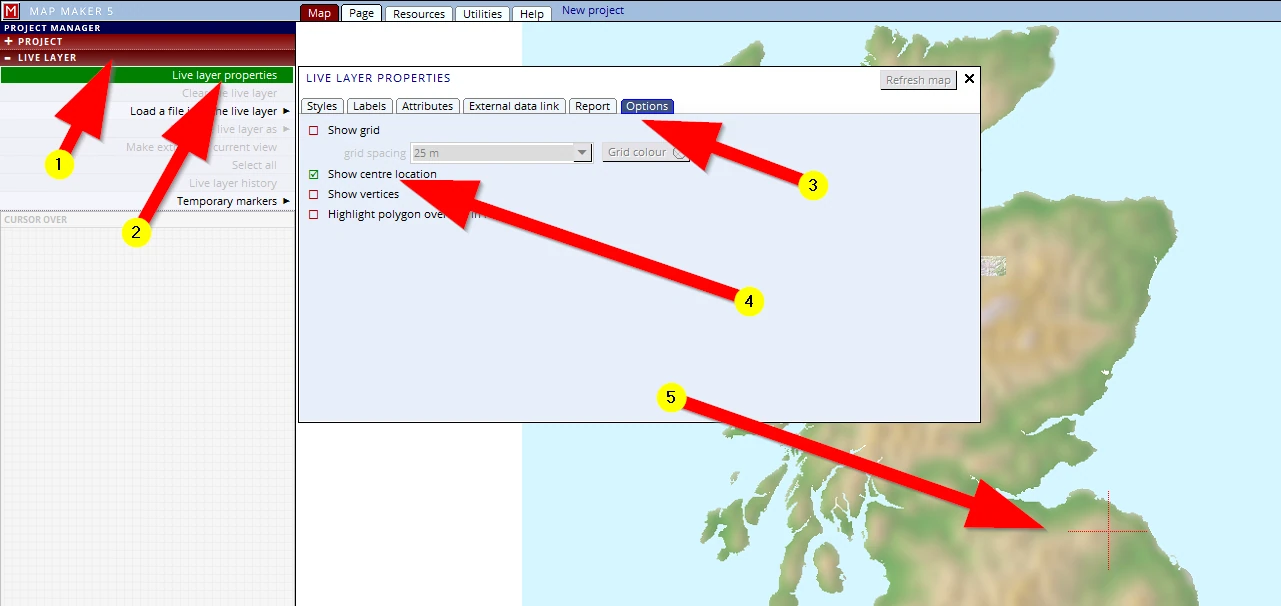
We can now Pan the map so that the site is in the centre of the screen.
The map is still way too big (for our map box of approx. 6 x 6cm). When we change the scale to 1: 8,000,000 it looks about right.
Before we started with map making, one of the first things we did was to ‘calibrated’ our screen. We therefore know that 1cm on screen will be 1cm on a paper print. So, to check if this is indeed a good scale, we can put a ruler against our screen and quickly check if this scale will work for us (6 x 6cm).
13.2 Creation of a simple location plan – Online Base-map data
An alternative map backdrop for UK map makers is this one:
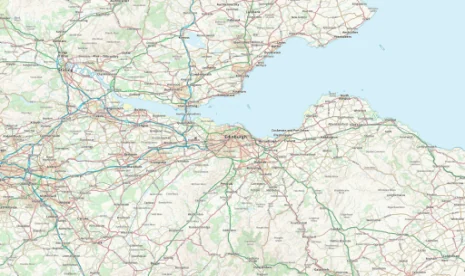
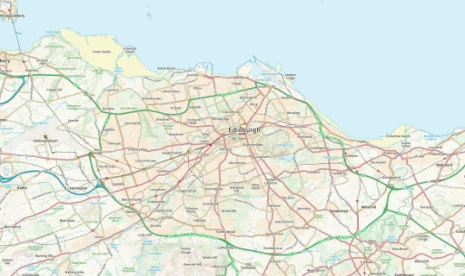
The National Mapping Agency of the UK has released some of its data as an open resource. One particular set is accessible online. And when we have a fast broadband connection we can add this data as a overview base layer in MM5!
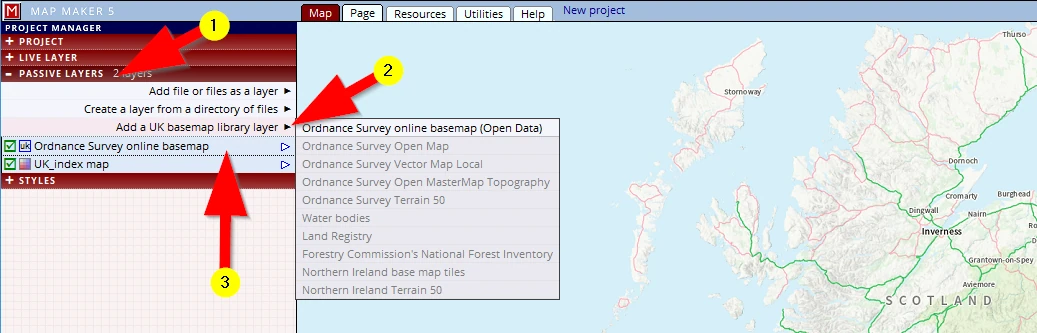
(1) In the PASSIVE LAYER header
(2) Add a UK Base-map library layer and select: Ordnance Survey online Base-map (Open Data)
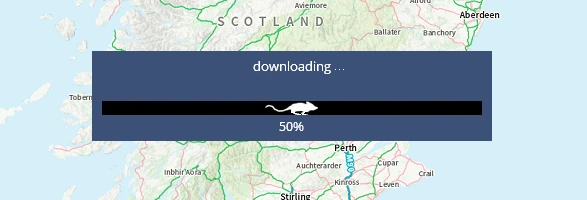
Your friendly resident computer mouse will start running:
(3) This UK Base-map will always come in at the bottom of the layer stack but can be moved up if need be.
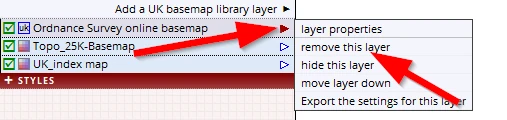
We can use this as an alternative Base-map. Naturally we could have added this layer immediately in a blank new project. We prefer the colours of the UK Indexmap.tif and will use this for our map so we will remove it again.
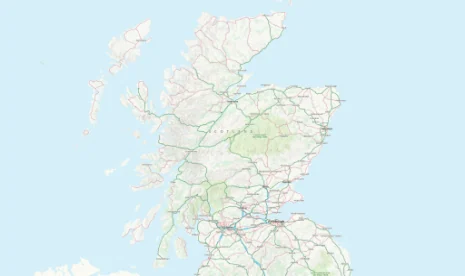
For UK users, bear this layer in mind, for it is a very useful dataset particularly for these kind of overview maps.
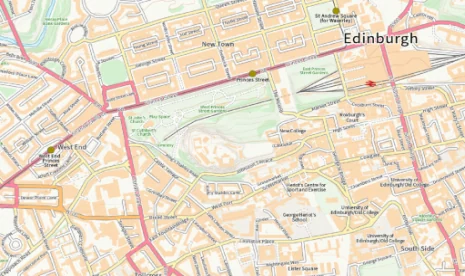
Zoom in anywhere of interest, and with each scale more detail will be shown. This is raster data and we can see it starts ‘pixelating’ at about 1:6,000 scale.
13.3 Custom page size
We need to set up the page so we click on the Page tab. It opens on the default A4 size. We already know we only want a map of 6 x 6cm so we need to change this.
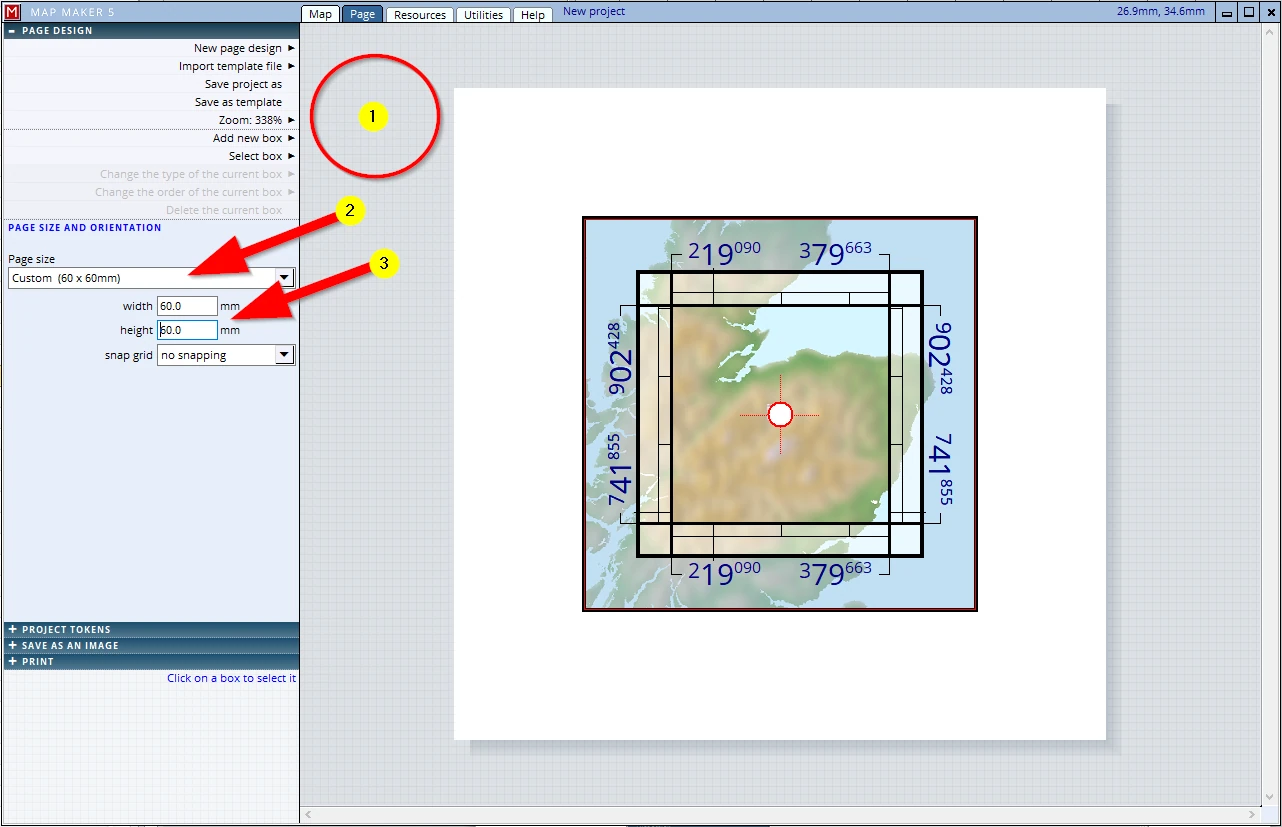
(1) A single click anywhere off the page (in the grey) and the interface opens the menu dealing with the page size
(2) Click on this little arrow and scroll up to find Custom
(3) Type in the dimensions (in mm) and observe that the page size shrinks to this square
The given map collar is nonsensical in this scenario, we need to change this to a single blank line:
(1) Click in the main map box
(2) Click on the Collar tab
(3) Change it to a single line border
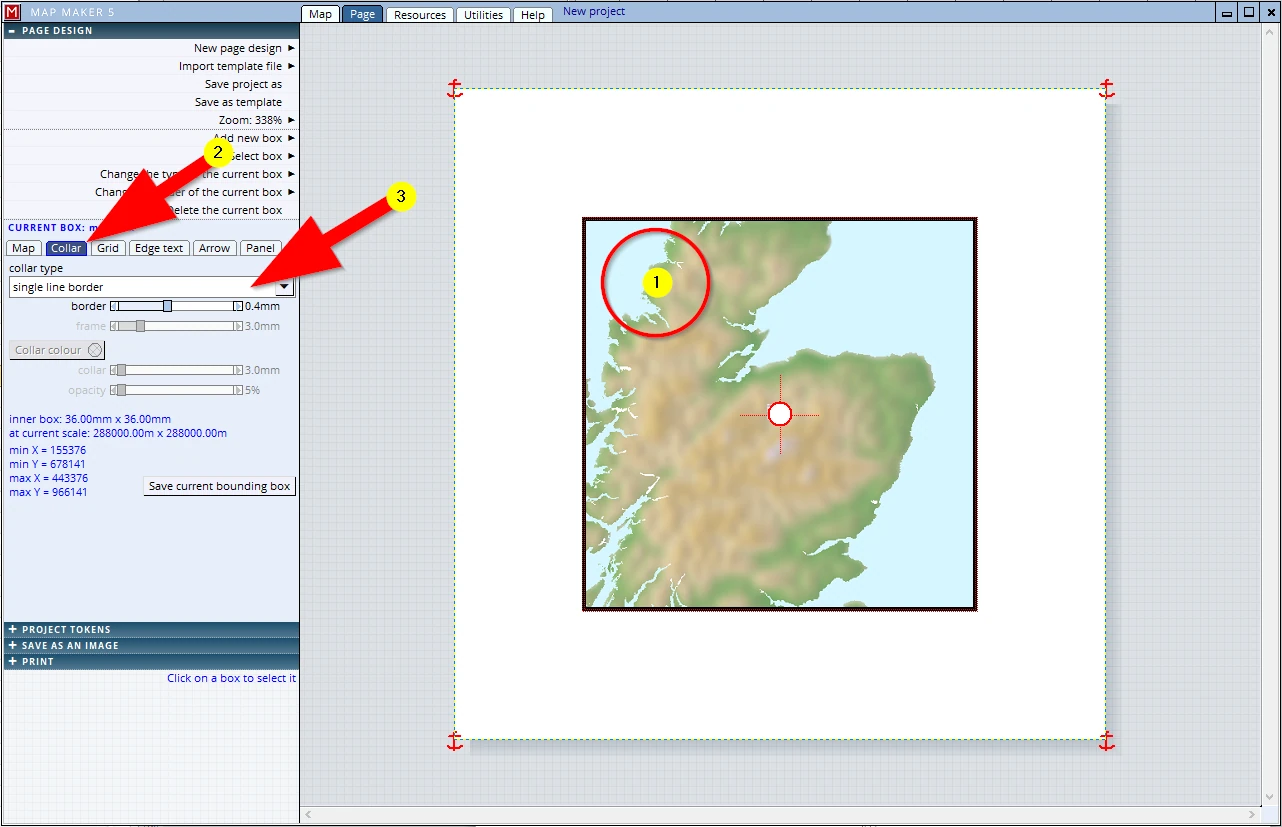
The map should fill the ‘page’. To do so:
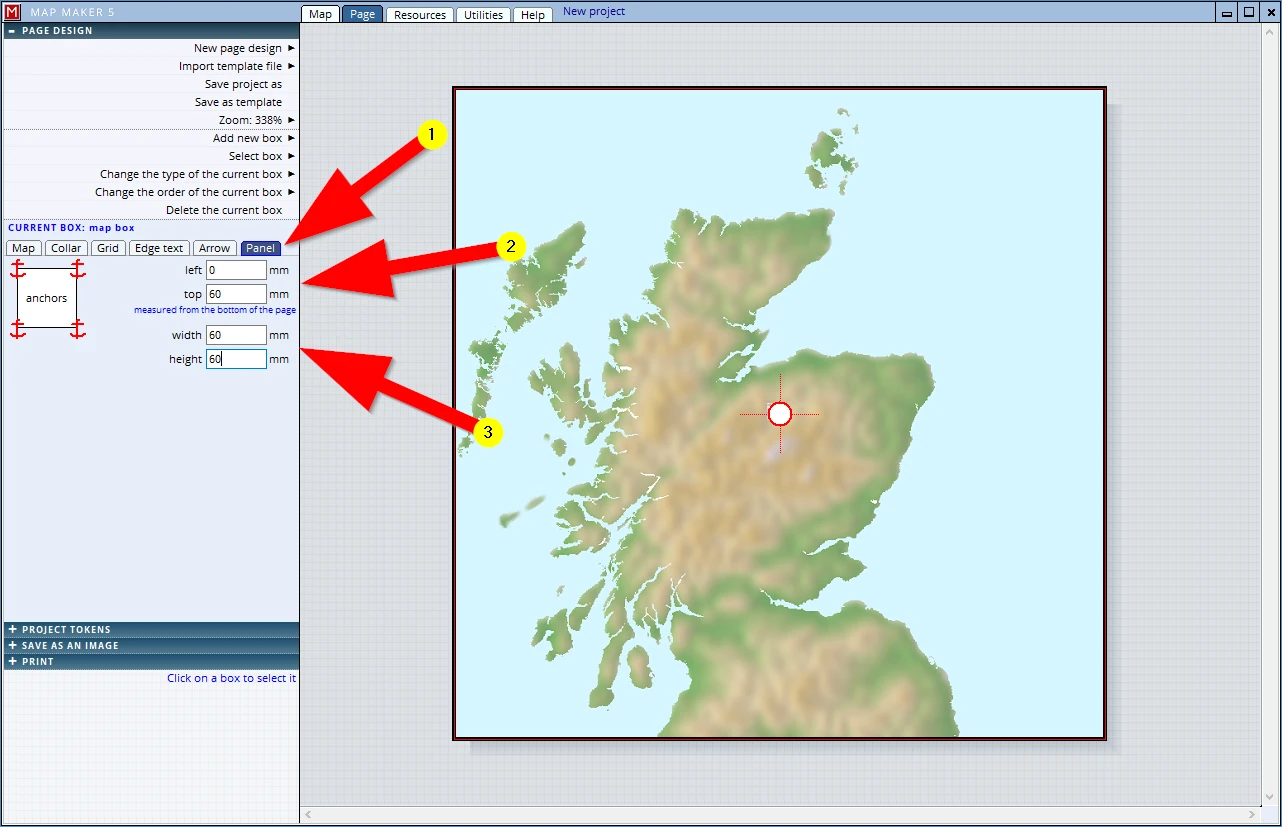
(1) Click on the Panel tab
(2)Change the offset from the left and top to 0mm
(3)Change the current width and height of the panel to 60mm
Although our project area is neatly in the centre, it looks a bit odd that Scotland is slightly off centre.
We can pan this image as follows:
In the centre of this view there is a white circle with a red border. Click inside this circle, hold and drag the white circle to the right.
Be careful to click in the circle when trying to drag, because if you are outside this circle you will be moving the map frame to a new location.
When all is done, F1, to save your project!
13.4 Save as an image (JPG)
We know we will have to write a report on this site, and in it we would like to include this location map. For that reason we will save this map as a JPG:
(1) Click on the header SAVE AS IMAGE
(2) Change the resolution to 150 dots per inch
(3) Save to JPG file
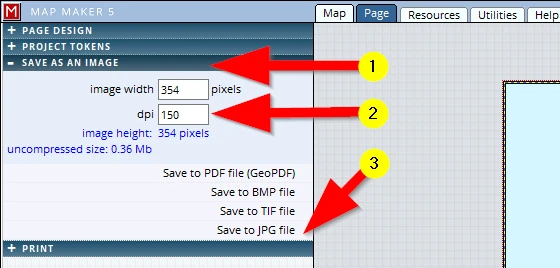
Save it in the training folder and give it a name (e.g. ‘Location map’)
Just to be sure, F1 to save your project...
We are now ready to include this location plan in our main map, so we will open ‘My first map-session 8’: (1-3)

13.5 Insert location map into template
We want to insert this location plan into the page template, so we need to open the Page tab and in the header
PAGE DESIGN, we click: Add a new box
The Map tab allows us to insert a specific map maker project. There are a few settings which we need to change:
(1) Open the Map tab
(2) Click the option Show project from a file, then Choose project and browse to the training folder to pick up ‘Location Map.geo’.
(3) Click the box: Preview map
(4) Click the box: As location map
(5) This box is a normal ‘map’ box, just like the main map frame. This means we can adjust the collar and all other settings in a similar way. Similarly, we can make use of the central white circle to pan the map should there be a need to.
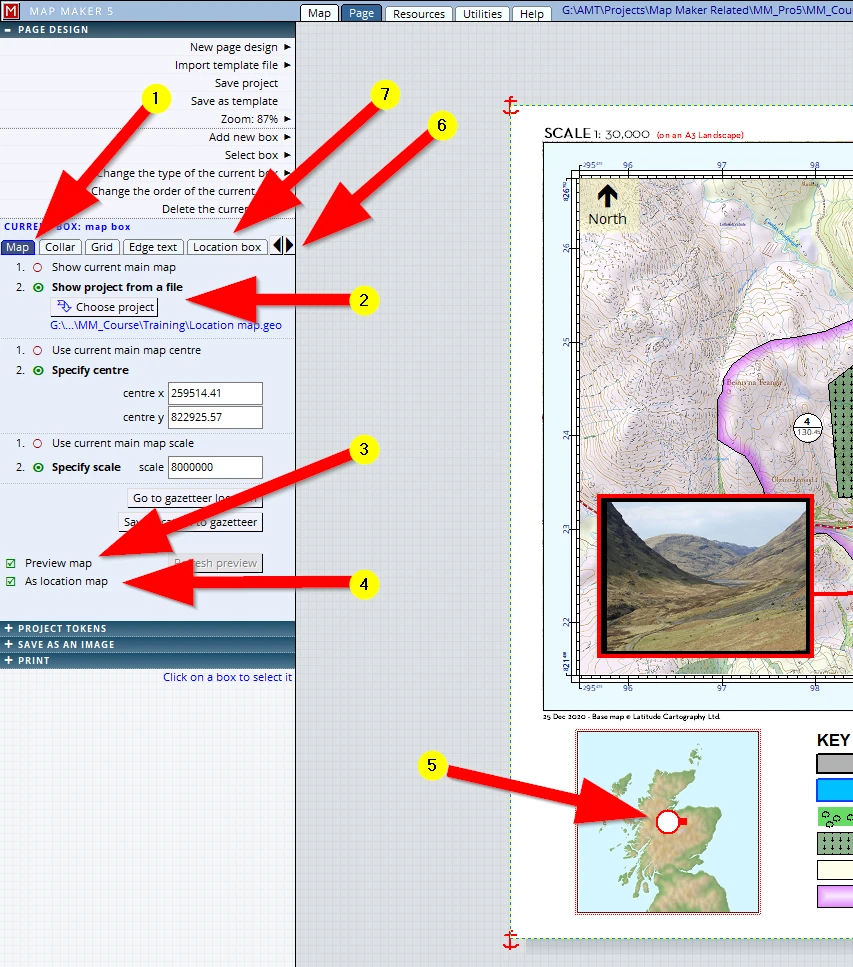
(6)Note these little ‘left and right’ arrows which take us to more tabs.
Please use it to see the ...
(7) Location box tab. In the location plan, our project area is now automatically highlighted by a border because we ticked the box ‘As location map’. We can adjust some settings for that border as well. To do that, please activate the Location box tab. Here we can change the border colour (to e.g. red), and because at this scale the rectangle is rather small, we can adjust the line width to e.g. 2mm so that it becomes more like a symbol, clearly visible.
By now our map looks something like this:
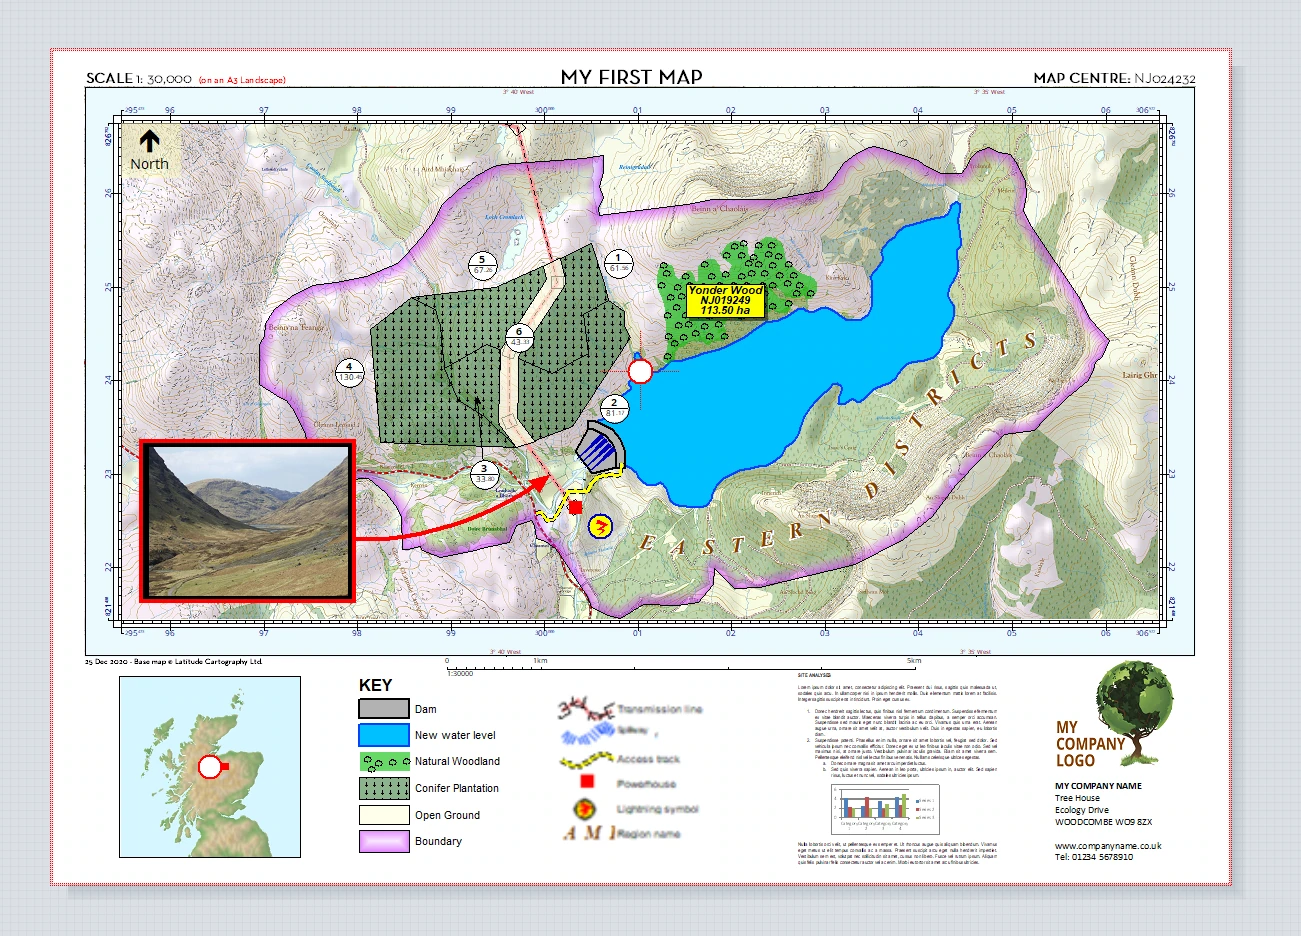
We like what we see so we will save our project, F1!
Almost ready to print.
Almost…? It looks good, doesn’t it?
14 MAP TWEAKS / MAP EDITING
Although we have worked up-close on the map and we think we can send a copy out, when we look at it with a critical eye there are a few things that still need our attention.
In Page view the entire ‘sheet’ is shown in full view and thus we cannot see the finer detail. However, we can change the zoom setting here:
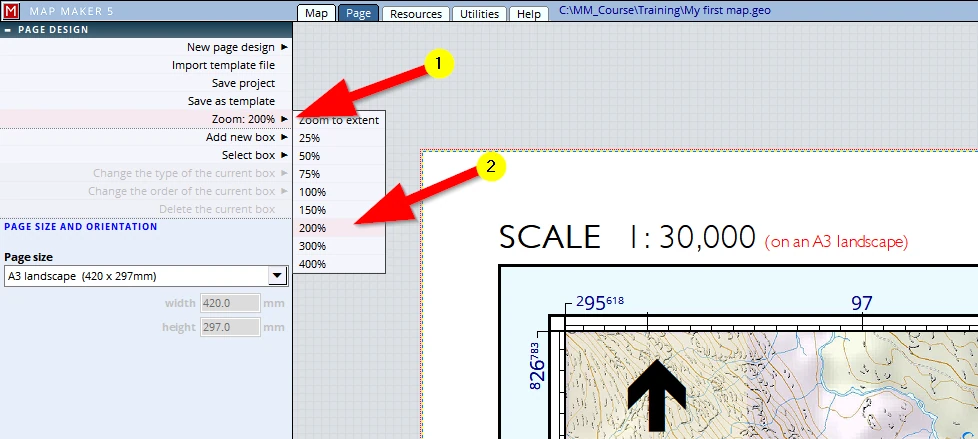
Once we are zoomed in we can use these scroll bars to move the image:
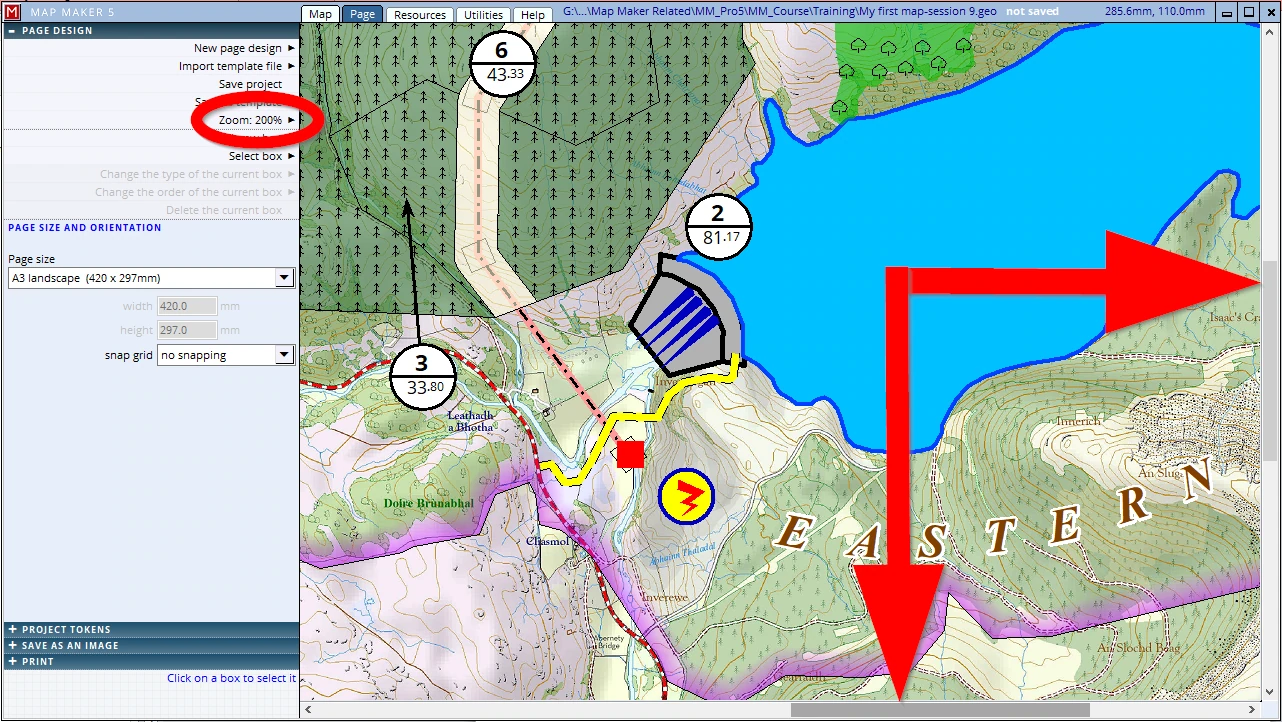
Don’t try to ‘drag’ the image, we will only be moving the map box to a different location on the sheet of paper! If it needs a pan; aim for the central white circle!
Although we can even zoom in to 400% and thus see the finer detail up close, believe you me, it always pays off to make a physical print first and check the paper output. There is a difference how we humans absorb information, either digital and on screen, or tangible in hand. The latter, proven in practise, is best.
Now that we have the first print in hand (and/or are looking at it up close on screen with a different zoom percentage) we can see there are several small issues which need some attention:
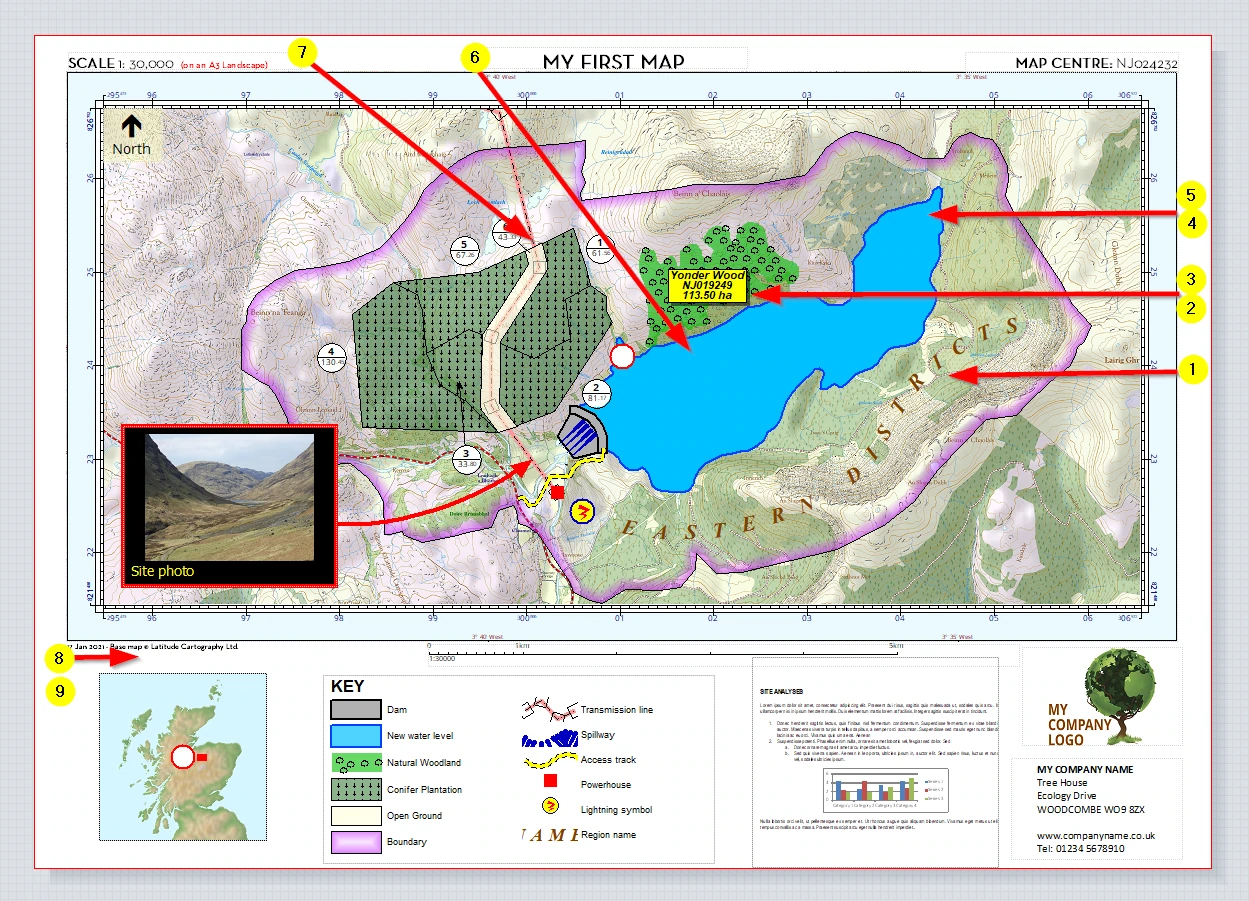
(1) We got our facts wrong: the name ‘Eastern Districts’ should be Southern Districts’
(2) The label of ‘Yonder Wood’ should be shifted - it obscures what it relates to. And when it is moved next to the woodlands, we want some sort of arrow pointing back to the woodland
---
(3) The label is also rather big and can be a bit smaller
(4) The blue fill of the new water level is ‘opaque’. It will be more informative if it is slightly transparent
---
(5) We want to show the area of the new water level
(6) We want to add the layer with the dimension line and show that measurement
(7) Near the powerhouse, the transmission line seems to run underground when crossing the road and it changes colour when it enters the woodland – also suggesting it might perhaps be underground - a confusing message to the map readers
---
(8) We have ‘eyeballed’ all template boxes into place by simply dragging them into a good location. When we are in a hurry, and for many people this is good enough, but for those working in a larger organisation or for those who really want to produce top quality output, looking at them up close we see we can improve their position.
(9) The bottom half of the map is rather a jumble of information - the map readers’ eye will move to and fro trying the absorb the information of the different components. We can improve on that.
We must go about adjusting all these issues in different ways:
- 1.We know by now that physical changes to a layer can only be changed in the live layer. Our observations 1-2 require such physical changes, and so we must copy a specific layer back into the live layer if we want to change something in it.
- 2.Observations 3 and 4 deal with the ‘styling’: colours and font sizes. These are governed in the project style set.
- 3.Observations 5-7 have to do with passive layer settings. Managing the layers, what they show and how they behave, can be done in the project manager header: PASSIVE LAYERS.
- 4.The last observations 8 & 9 relate to improvements in the template.
14.1 Editing existing layers
Observations 1-2: physical changes to map objects
1. The name change
We got our facts wrong and the annotation ‘Eastern Districts’ should be changed to ‘Southern Districts’. Looking in the PASSIVE LAYERS header we see a long list with layers. In our scenario all layer titles suggest what is in it, but sometimes such layer titles might be a bit obscure and after a long time we might not immediately know which layer we should be working in.
A safe way to analyse which layer we need to work in is this:
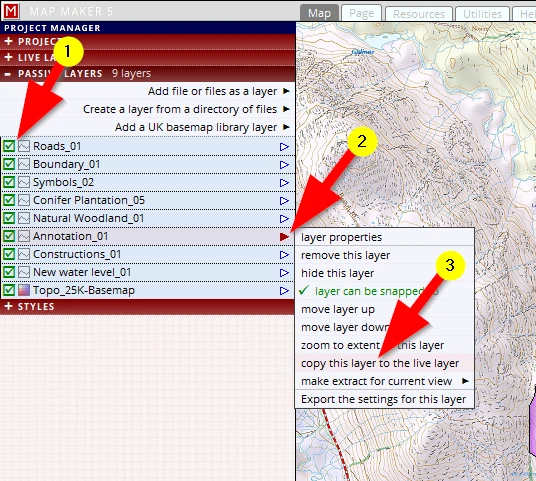
(1) Starting with the first layer, tick the ‘hide layer’ box - when the object we want to change did not disappear we know this is not the layer we want to edit - make it visible again and try the next. Once we know which layer the object is in we want to physically change...
(2) Click on the little blue arrow (which then turns red)
(3) Click on the option copy this layer to the live layer
We now see that the little blue dot appearing, indicating this object is in the live layer and we can now edit the annotation. Select the EDIT tool and click on the annotation ‘Eastern District’ to edit it in the CAPTION header. Confirm the edit, then save the layer again. As per the advised methodology of saving your work, we could increase its version number. But since this was such a tiny change where little can have gone wrong, we could just save the file with the same name.
But note this: the layer was well down in the stack. Now that it has been a live layer and is saved again, it ends up on top. Remember the paper world ink & pen analogy? In the paper world this is what we would have to do as well, pull a transparency out off the stack, put it on top and only then we can draw on it.
Save your project (F1).
2. Change the label location & add arrow
Copy the relevant layer into the live layer (Natural Woodlands_01)
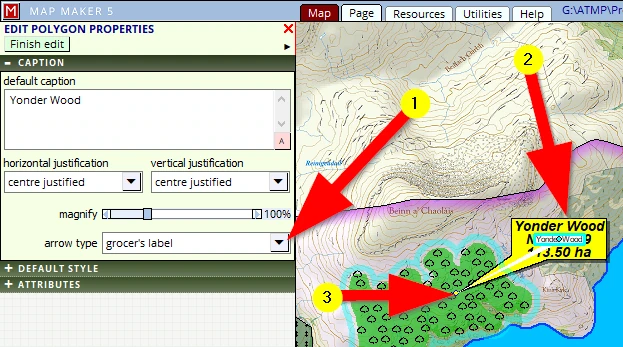
Activate the EDIT tool. Click in the polygon, then in the CAPTION header
(1) Select the “grocer’s” label (see image)
(2) click hold and drag the label to a better location.
(3) click, hold and drag the location where the pointer is pointing to also move that and to a better location.
Save this layer (with an increased version number)
Save your project (F1).
14.2 Styling changes (colours, label size etc.)
Observations 3 & 4
3. Changes in label size
The next observation is that we want to change the size of the “Yonder Wood” label. Labels show the captions of polygons, lines and points. This is different from changing the size of a map object ”text” - which is always object specific and is always defined in metres on the ground.
Well now, there are two ways forward (and a third option for foresters!):
- a)A global change through the layers.
- b)An object specific change.
- c)Forestry ‘split circle’ size.
Global label size change
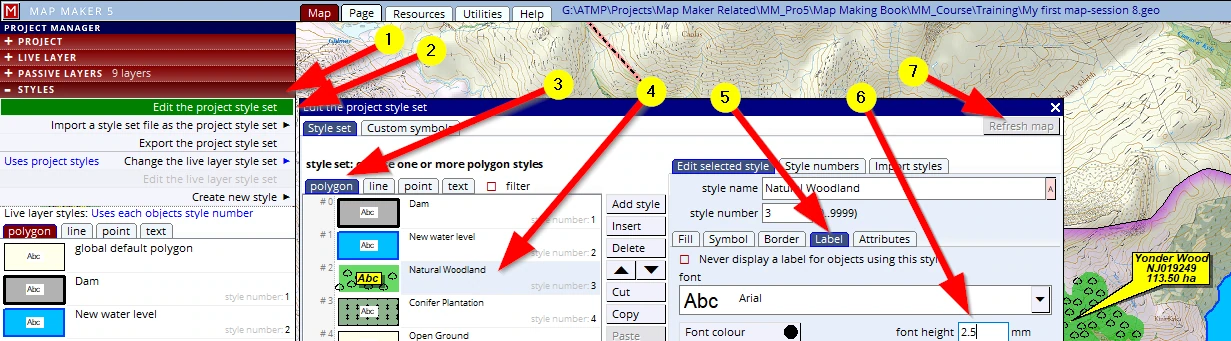
- a.The structural, global, label size change (throughout the layer in one style) is done by adjusting the font in the Project style set. We have done this before, here it is again (1-7):
And of course: the label tab (5) can be found in any of the four map object tabs (polygons, lines, points & texts) because all of the map objects can have a label
Individual object label size change
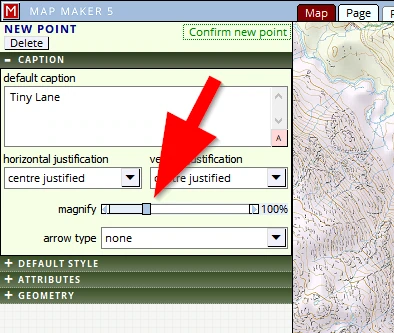
- b.The first option changes the appearance of those labels through the project style set. However in map making you will soon find out we regularly need to come up with solutions for ‘exceptions to the rule’, and this often applies to the size of labels. For example, think of road names. On a map most of these will have a set font height, but the odd road, e.g. a cul-de-sac, which is too small or narrow to show the given default label height, may need a smaller font. We need to be able to change only this one label to make it legible.
MM5 offers a special option: With the object in the live layer, click on it with the EDIT tool and head for the CAPTION header. There you will see an option to magnify this individual label (increase or decrease).
Size change of forestry ‘Split Circle labels’
- c.An exception in dealing with label sizes are the forestry ‘split circle’ labels. This can be found in the layer properties menu:
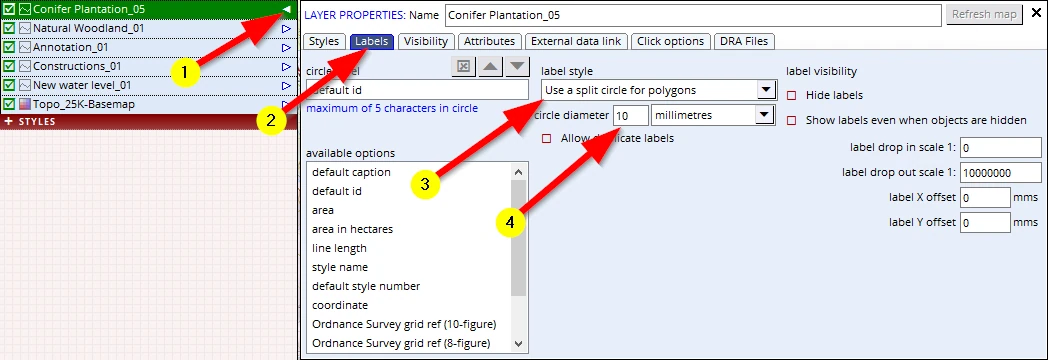
After any of these changes: save your project (F1).
4. Changes to a polygon fill type
We felt it might look better if the ‘New Water Level’ fill was not opaque but was more translucent - it will show the old topography.
Again, it is a styling issue, and so we need to edit the project style file. Open the project style set header, go to the polygon tab, Select the polygon entry ‘New Water Level’ and change the fill opacity to about 70%.
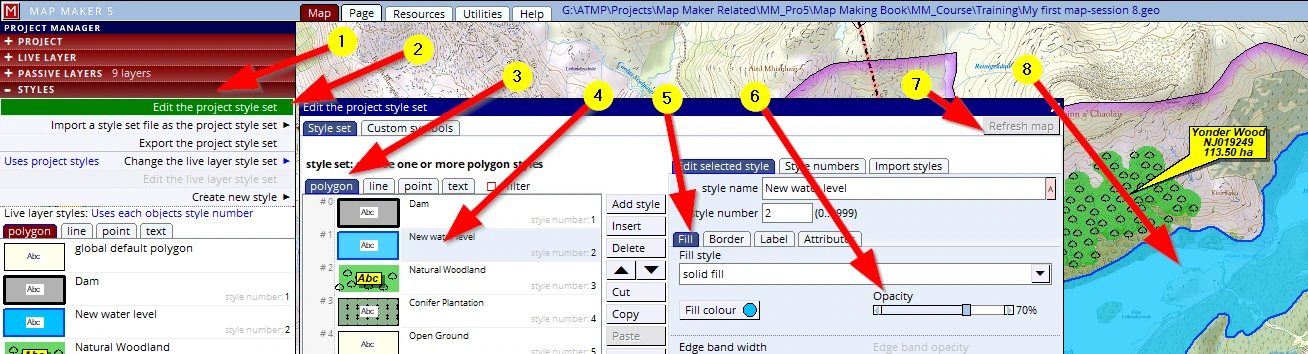
Refresh the map (7) and see the change (8)
Save your project (F1).
14.3 Passive layer changes
Observations 5-7:
5. Changes to what the labels shows
We want to show the area of the new maximum water level. This is not a physical change, nor has it to do with the styling. It has to do with what the layer is showing. This is governed in the PASSIVE LAYERS header, the layer properties menu.
(1-4) Open the PASSIVE LAYERS header, select the “New water level_01” layer, click on the little arrow and select the layer properties option from the menu which will pop up, then click on the Labels tab and select the label area in hectares. Refresh and observe the new label (5-6).
The label is perhaps a bit too small. We know how to change this (see above, tweak 3a!).
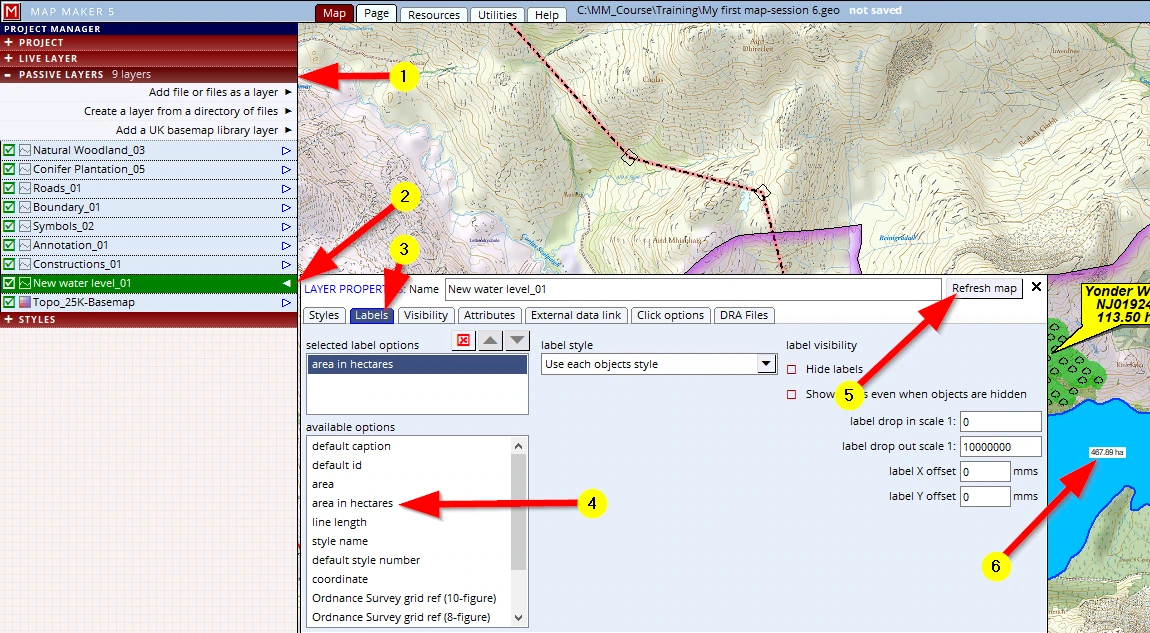
Save your project (F1).
6. Adding a layer from file
We have decided to slot in the layer with the dimension line in it. It is an existing layer, previous work, so we do not have to draw it, we just want to add it to our project.
(1) Click on the header PASSIVE LAYERS
(2) Click on the option Add file or files as a layer
Browse to the folder where you know the file lives:
C:\MM_Course\Training\Dimensions_01
Select it and OK the menu away (bottom right).
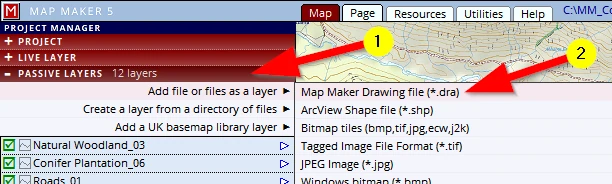
Note that it reads ‘Add file or files...’; we can hold Ctrl (or Shift for a range) to select multiple files in one sweep. This is not often used when loading *.dra files but it is most practical to load multiple Base-map (raster) files in one action.
A new layer always comes in on top of the other layers and will use the style numbers (if there are any) in the *.dra. Remember when we drew this line? We did not assign any style number to it, and so it shows as a plain black “default” line.
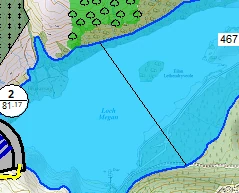
This is a typical scenario when it comes to bringing in layers produced by others - they might have used different software and we don’t know (yet) how each object is coloured. We want this line to show as a red arrow line with a label showing its length.
Dimension line with length label
This is the type of dimension line we have in mind:
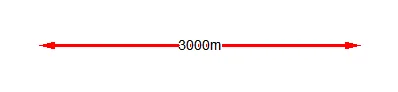
We need to set up a style for this:
(1) Open the STYLE header
(2) Click on Edit the project style set
(3) Click on the line tab
(4) We can now insert a new style or change an existing style. We will change the given entry ‘level 3’ and select it
(5) Rename it to ‘Dimension arrow line’
(6) Make it thicker (e.g. 0.8mm)
(7) Adjust the line colour to red and
(8) Adjust the line start end and line finish end to show arrows in this section
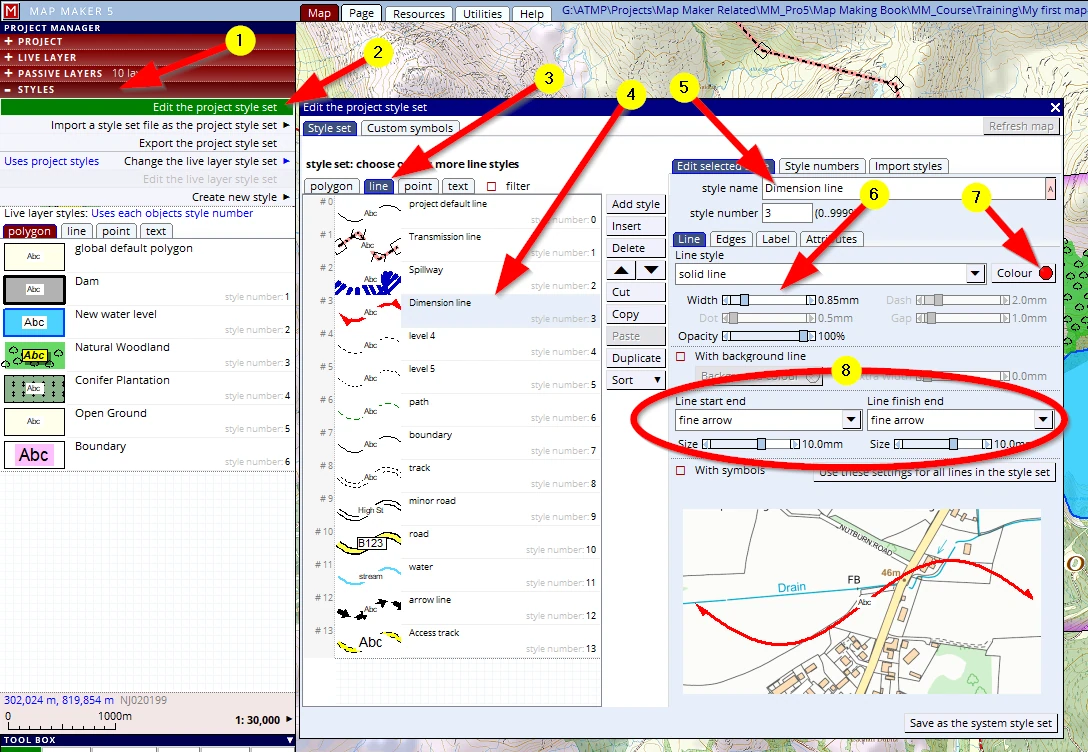
Please close this menu and save our project (to save this new style): F1.
Copy this dimension line into the live layer, activate the EDIT tool and change the style so it shows up as intended.
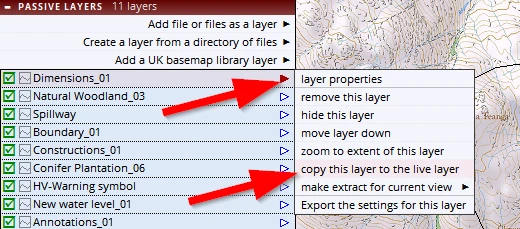
However, the label does not show the length of the line yet.
This layer is now a live layer, and we want to see a specific label.
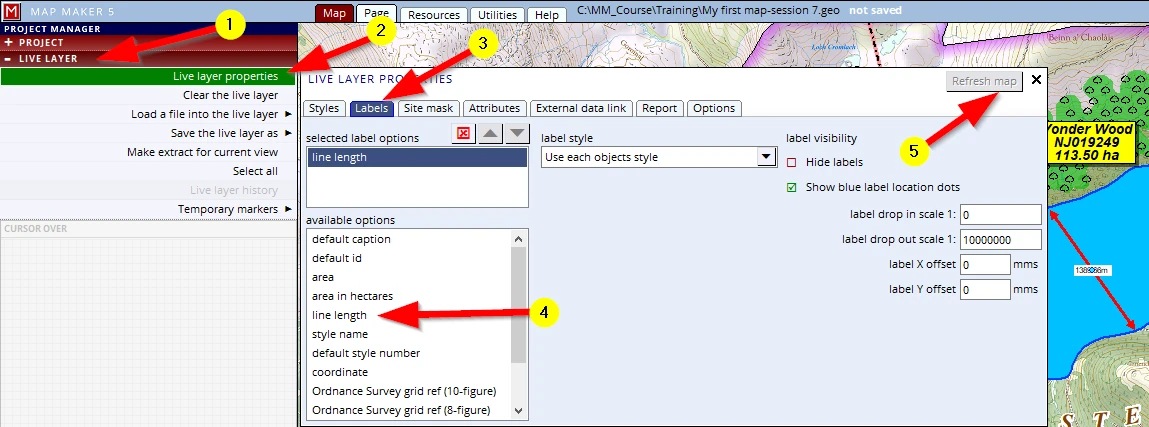
(1-3) In the LIVE LAYER header, open the layer properties menu, on the Labels tab.
(4) Select the label line length label and see it appear in the second window of selected label options
(5) Refresh map to see the label appear. But as can be seen, the label is horizontal, and we want it to be parallel to the line.
Activate the EDIT tool and click on the line. The EDIT LINE PROPERTIES menu will open,
(1) Click on the CAPTION header
(2) Open the choice menu under the caption line label positioning option.
(3) Select the last option label parallel to the line
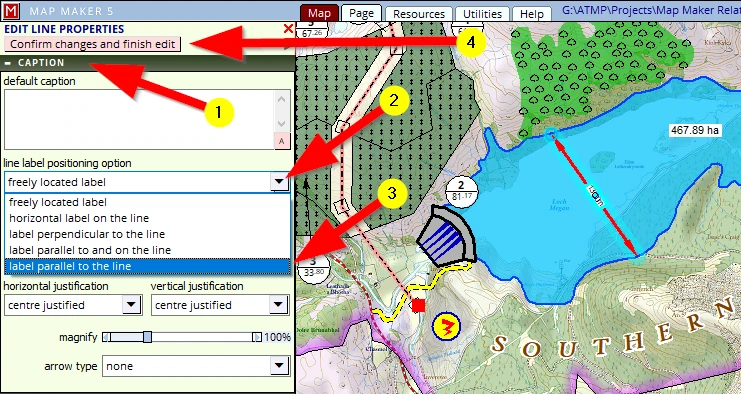
(4) Confirm changes and finish edit.
Save the live layer (with increased version number) and save the project. (F1)
7. Changes to the sequence of layers
As we started our project, we drew the dam first, then the water level. Because of that, the latter layer lived on top of the former, suggesting that the water spills over the dam. We changed the sequence of how the layers were stacked in the first session.
When we now look up close to the Transmission line we see a similar phenomenon. It seems to run under the road which we drew and seems to run under the woodland open ground. (1)
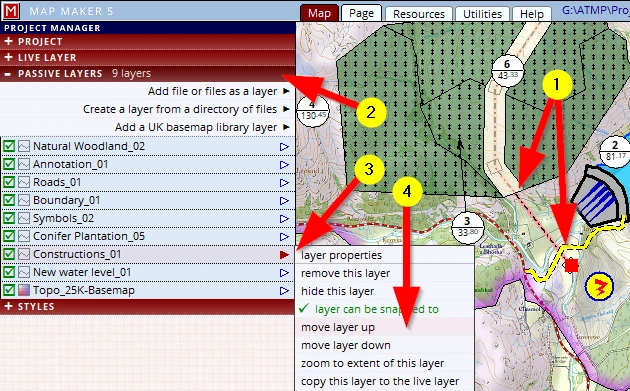
We can change the sequence in which the layers appear on screen in the PASSIVE LAYERS header (2)
Select the relevant layer and click, hold & drag it to a better location.
Alternatively:
select the relevant layer and click on the little arrow next to it (3) to open up the pop-up menu and select
move layer up or move layer down from it so that the transmission line is on top of the others (4).
As mentioned before, in order to know which layer contains what, it is best to ‘hide’ and ‘unhide’ the layer.
Save your project (F1).
14.4 Changes to the template
Observations 8 & 9:
8. Panel locations
So far we have just dragged the panels into a suitable position and often that works out fine.
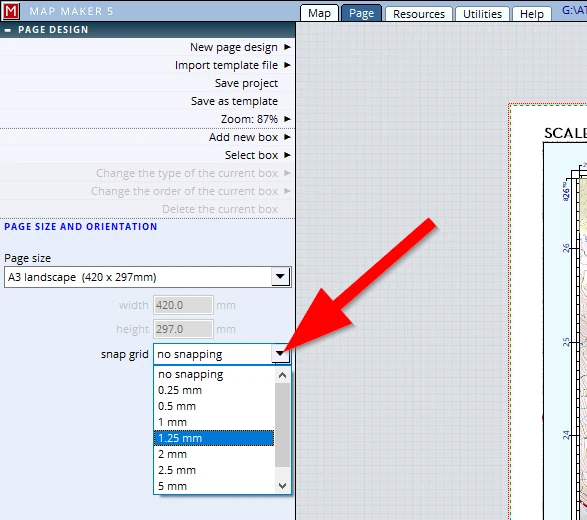
To assist with this positioning process, we could have made use of ‘snap’ settings.
It is best to activate that before we start designing the template.
We did not do that, and when we now look up close to the panels we see that their alignment can be improved.
We can type in exact values in the Panel tab. Using these options we can align our boxes to perfection. So let’s change some:
Looking at the “SCALE” box, we might be inclined to align it perfectly with the map edge. But personally we feel that it sometimes looks better when there is a certain offset involved, as in the example below. A deliberate offset makes it slightly less regimented. We will tweak all panels on the corners with an offset like this.
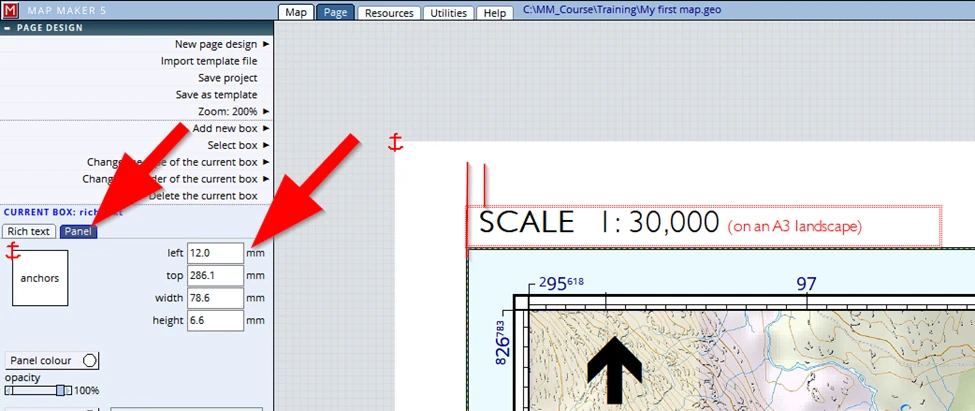
Once done: save your project (F1).
Looking at the panels in the bottom section, we note quite some misalignments which can be improved using the type-in values as shown in the previous image:
From this:
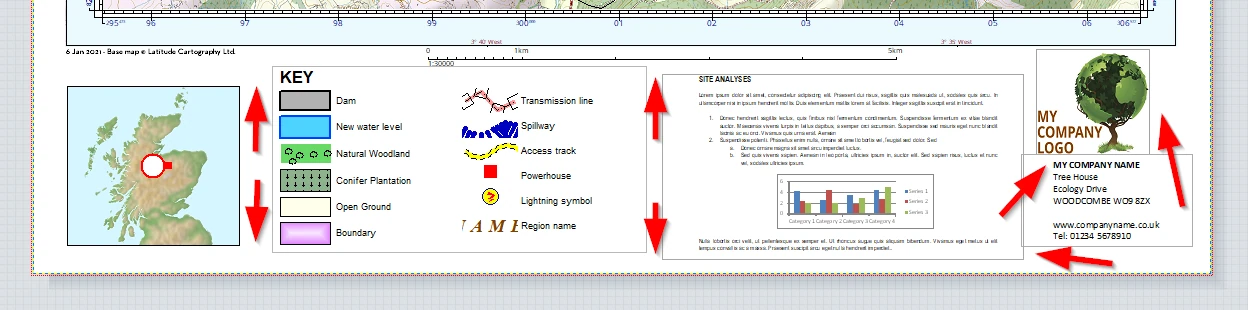
To this:
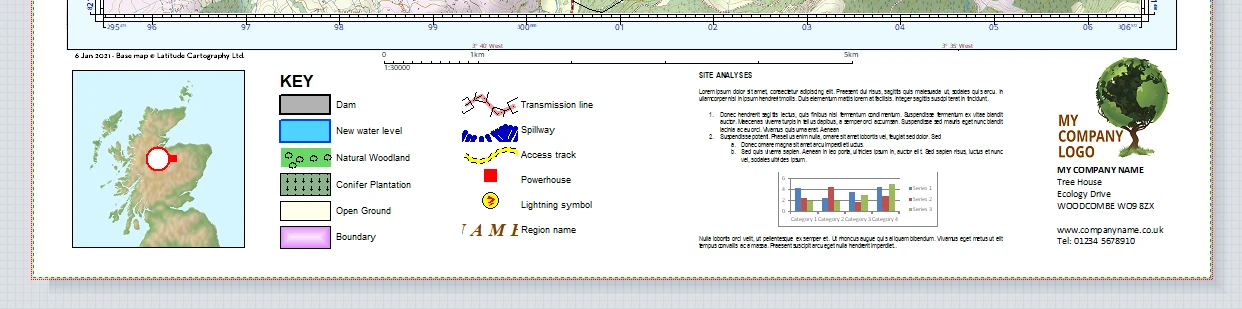
9. Panel improvements
Although the various panels have been aligned, looking at the overall effect, it still feels like a jumble of information which can be distracting. Our eyes are wandering to and fro over this map because of the amount of information to take in.
We can improve this by introducing a border around the legend and that text document. In addition to that we can introduce a very faint yellow colour to visually group the components, creating a more ‘peaceful’ presentation. Try the following:
Whilst in Page view,
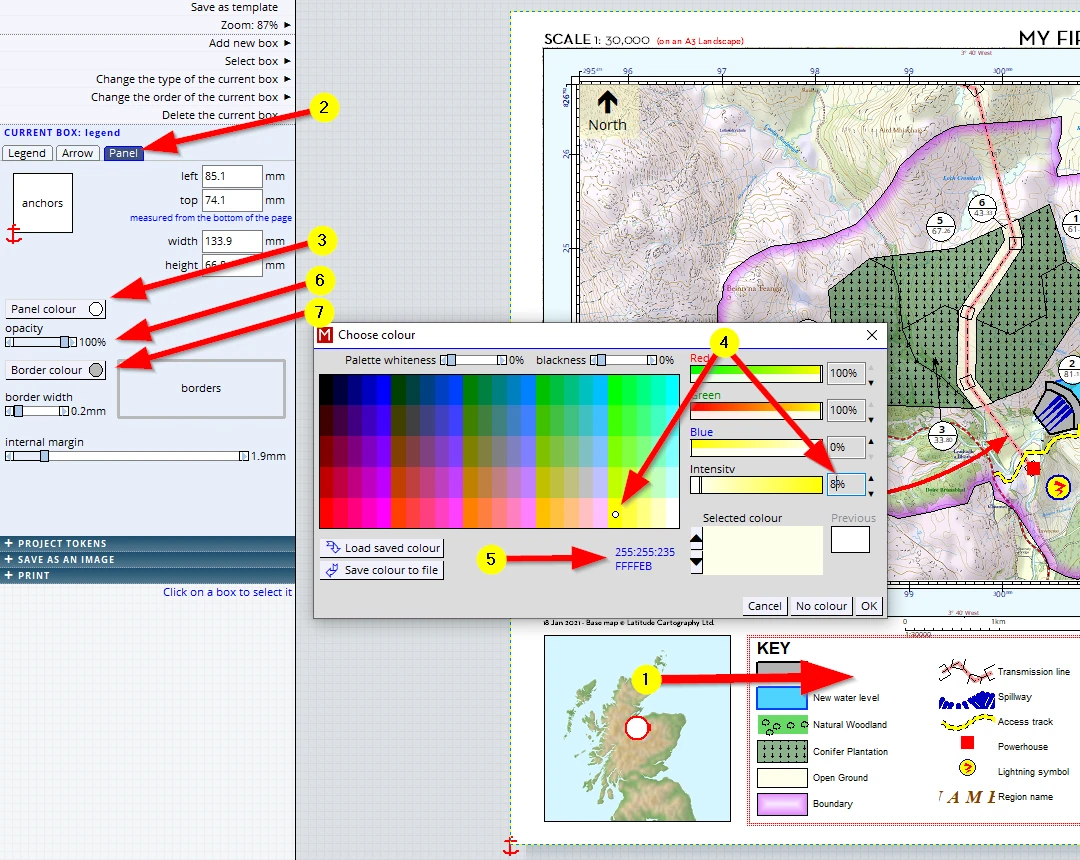
(1) Click in the legend box
(2) Open the Panel tab
(3) Click on the Panel Colour button
(4) Chose a very faint yellow (we opted for 8% intensity of the full yellow)
(5) Make note or remember which colour we chose for we need to do it with the other panel as well.
Alternatively: MM5 also allows you to copy the RGB setting or hexadecimal code below it into memory, and paste it again later.
(6) Change the opacity of the panel to 100%
(7) Change the Border colour to a faint grey
(i.e. Black & intensity 20%)
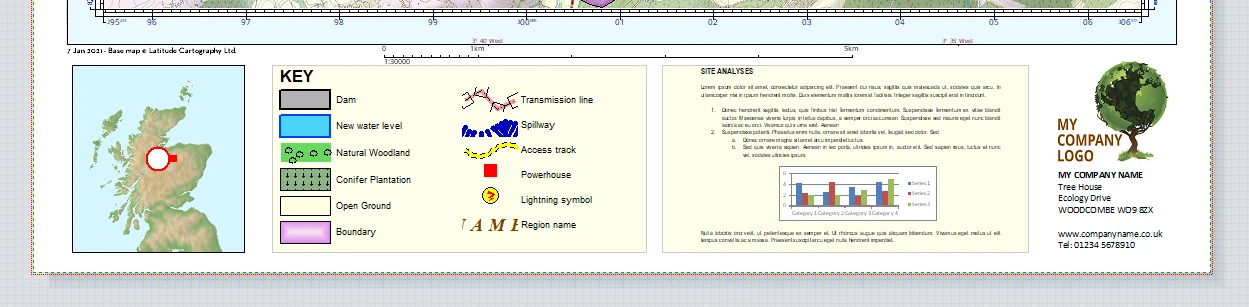
This is just a trick which we do not always have to do, but in this scenario, it works.
Save your project (F1).
We are well pleased with the overall look, so we are now good to go!
15 PUBLISHING
To publish this map we can either ‘go digital’ and or indeed PRINT it to paper.
We will select SAVE AS AN IMAGE first
15.1 Save as an image (pdf, jpg etc.)
Once the header SAVE AS AN IMAGE is opened (1) we can input some numbers (2), and below it we can see some file formats we can save the map to (3).
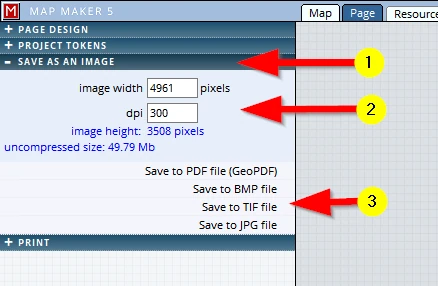
Our map is made up of layers: some are raster layers, others are vector layers. But when we use this ‘Save as an image’ option, MM5 will ‘flatten’ all layers and turn it into a simple raster file.
The dpi settings (2):
As explained in Chapter 4, raster files are defined by the number of ‘dots per inch’: the more dots, the better the image but also the larger the file size. This is your call, your decision. For an email 150 dpi is a good resolution, for a high quality print 300 dpi is best (some printers recommend 600dpi… watch the file size increase!). MM5 calculates the ‘uncompressed file’ size (blue text below the dpi), but some of these file formats like jpg, will ‘compress’ the image and the resultant file will thus be much less.
Save to PDF file (GeoPDF)
It does what it says on the tin: a PDF file will be created. A PDF is a ‘Portable Document File’ which is a generic file format, to some extent it is software independent. It is a so-called ‘Geo’ PDF, and that means that the projection data, the X&Y settings in which we work are saved into this document as well. And that in turns means this PDF can also be used in, for example, mobile devices in combination with the on-board GPS. This is of course very practical when out in the field.
We can make good use of saving our map in these file formats, not only to exchange our data between other users, but it also opens the door to design poster maps. Not all of us have access to, for example, an A0 poster printer, and with these options we could now send this file to a printer.
Save to BMP, TIF & JPG file (3)
These file formats are the most commonly used.
Starting with the last:
JPG (Joint Photographic Expert Group) is a compressed image - this means a loss of quality but with the advantage of a small file size.
TIF (Tagged Image File) is a compressed file format, but unlike JPG retains its quality, although larger in file size compared to JPG.
BMP (Bit MaP) is an ‘un-compressed’ file format, and thus will result in large files.
15.2 Print on paper
The next header is the PRINT header. This will bring us into the menu to actually print it to paper.
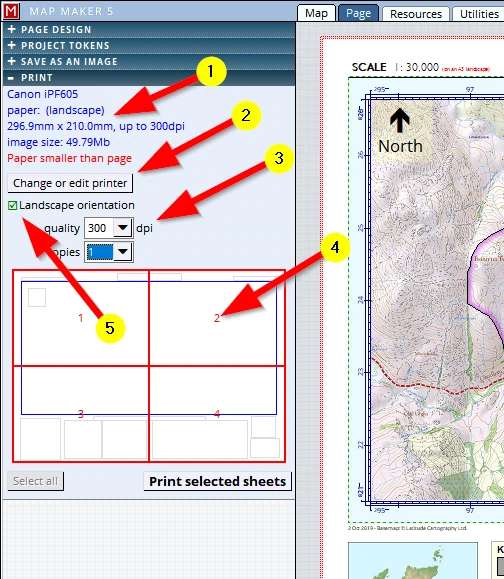
(1) The current selected printer is shown and what paper has been selected – in our scenario the default paper setting is an A4. MM5 recognises that our map page is designed to be printed on an A3 and so it breaks up this page into several printable pages (currently 4)
(2) Naturally we can change the current printer and its settings which govern colours quality etc.
(3) Here too we can specify the dpi as explained above (and we can specify how many copies are to be printed)
(4) We can click on any of the needed pages to ‘deselect’ it. This is particularly handy to save ink. First print out one sheet to see if the colours are as expected or to see if any more changes are required in line thickness or font sizes. Only then print all of them
(5) Our map page is an A3. And as you probably know, one A3 (Landscape) = two A4 (Portrait)
(And, by the way, that principle runs through this size indication range: A5, A4, A3, A2, A1 and A0
i.e. one A4 = two A5’s)
The tick-box shows the printer will print the map on 4 A4’s: Landscape. When it comes to the final print, obviously it is better to set this to ‘Portrait’ so that only 2 pages are required.
This poster printing option is of course very useful for those who do not have large format printers. The ‘tiles’ will have a small overlap so it is easy to stick them together.