Session 2
Tools
In Session 1 we created our very first map. We learned that any and every map only consists of 4 types of objects: Polygons; Lines; Points and Text and we used those tools. In this session we will press on with our first map and use more tools and we will learn some important basics about different types of map data!
3 Two useful tools: BRUSH & TAPE measure
3.1 The Polygon brush tool
The Polygon brush tool is a novel tool which to date (2021) we have not seen in any other mapping software package.
This is how it works:
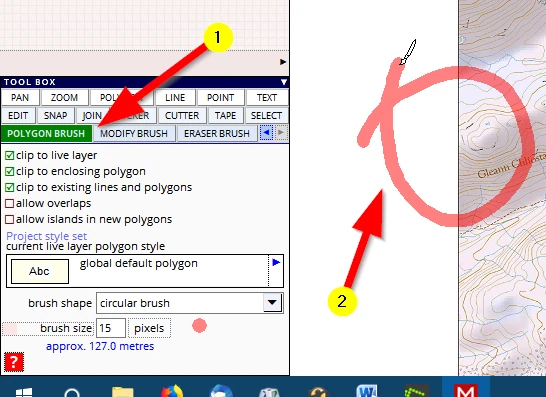
(1) Activate the tool
(2) Click, hold and draw a shape, like the loop below, and let go of the mouse button
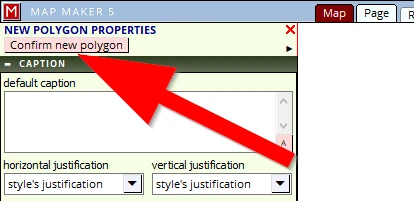
The new polygon dialogue menu opens on the left where we can assign a style number. Ignore all that for now, just confirm the shape in the top right menu
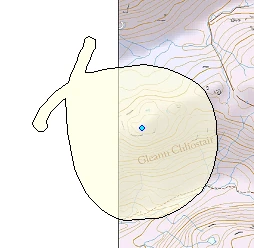
the resultant shape will look something like this:
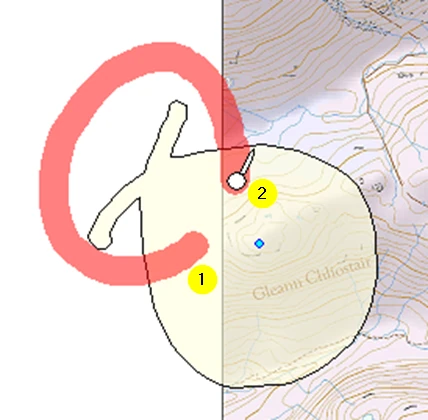
Activate the MODIFY BRUSH tool
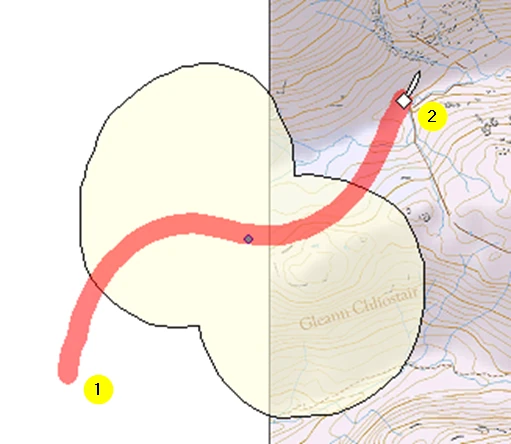
(1) Start in the polygon you have just created, click hold and draw a curve
(2) end up in the polygon again and let go of the mouse button
(3) this is the resultant polygon:
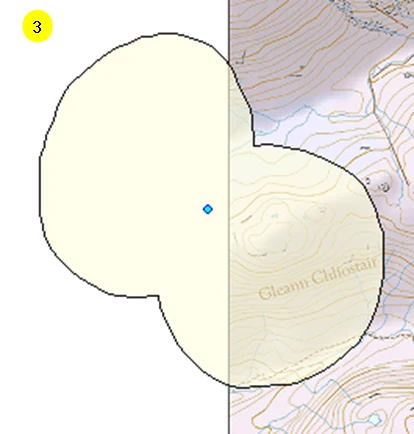
Activate the ERASER BRUSH
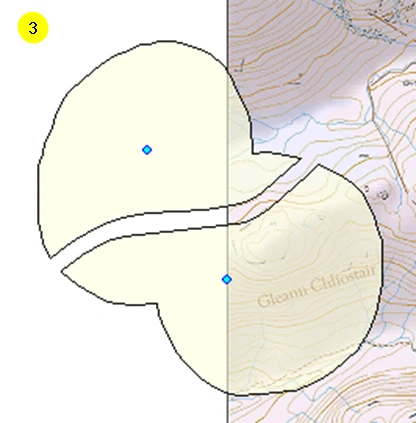
(1) Start e.g. outside the polygon you have just created, click hold and draw a curve
(2) end up outside the polygon again and let go of the mouse button
(3) This is the resultant polygon:
Note: one can start anywhere in or outside a polygon
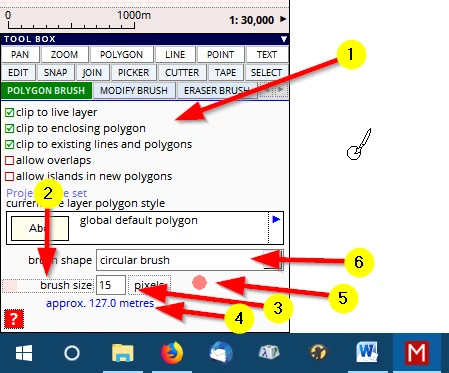
(1) With any of these three tools, please experiment with the various settings like those here in the POLYGON BRUSH tool:
(2) Click in this ‘slider’ section to change the size of the brush
(3) Alternatively, type in a different size
(4) This read-out informs us what the brush size (defined in screen pixels) will be in ‘meters on the ground’
(5) Click on the coloured dot, to change the colour (and opacity) of the brush stroke.
(6) The shape of the brush can also be changed.
You will have noticed that (compared to the polygon tool) it is difficult to draw a precise outline with this tool. That is because it is difficult to move your mouse free-hand, it records your every twitch. So it is important to fully appreciate its use.
This tool is a superfast way to draw natural, non-man made shapes. Think about shapes like the ‘new water level’ polygon we drew. Or e.g. a meandering river, or things like a heathland ecology survey, mapping out differences in vegetation grass/heather.
It is not only a superfast drawing tool, it is also a very powerful tool to edit, amend (filling in ‘gaps’ in your polygons) or extend existing work. It is beyond the scope of this beginners guide to deal with all this, just bear that in mind.
All along you may be saying: “a novel tool..? I have used things like this before in, for example, the very basic ‘MS Paint’ or software like Photoshop or Affinity Photo “
Well, yes, packages like these make use of ‘brushes’, but there is an important difference.
The aforementioned packages are ‘image’ editing tools, working with ‘pixels’. Whereas this brush tool is a ‘vector’ drawing tool.
It is important to understand the difference between pixel & vector data in digital map making.
Let us explain.
The difference between Pixel and Vector data.
This important difference is not difficult to understand.
Below we can see that we have drawn our test shape just over the edge of the Base-map. You could try the same.
Then: zoom in, and in ... and in ...and ... in.
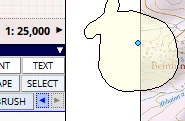
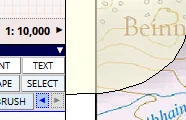
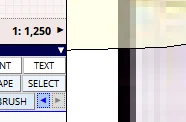
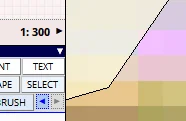
A first difference is staring you in the face.
What you see is that the line thickness of the outline of the polygon remains the same whereas the Base-map which looked so pretty started breaking up, into pixels, nay tiles!
At 10,000 it still looked OK, but at e.g. 1,250 scale the line work and fonts are all jagged and ‘pixelated’ and at 1:300 the pixels are huge on screen. To further explain this difference, let’s first try a new tool.
3.2 The Tape tool
(1) Please activate the TAPE tool and do the following:
(2) Adjust the settings like those as shown (Note that we can also change the units to foot and yards!)
(3) Move the cursor to the corner of one pixel square, click & hold and...
(4) drag to the second corner and observe the measured length (and angle). Because we have ticked the setting box show area we can now also move on to digitise the four corners and measure the area of this one pixel.
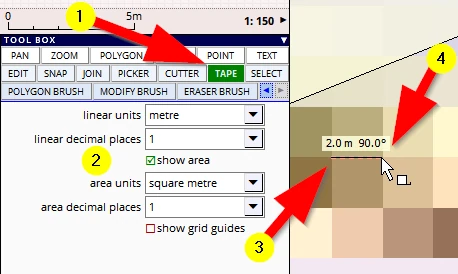
And that is how the TAPE measuring tool works.
We see that ‘raster’ data is build up by pixels, each pixel has a size which is related to a measurement on the ground. However, the polygon line which is vector data is a mathematically defined line and remains as thick as we have defined it in the style editor, and in this case it is 0.1 mm on paper. So, whatever scale we are zoomed in, the line will be shown as 0.1mm on screen/paper. NB: On the images above we see distanced shape edged pixels, on your screen you will see that MM5 blurs the edges of image pixels to make a smooth image.
In the next chapter we will explain a bit more about the fundamental difference between vector and raster data because when it comes to ordering Base-map data we need to know exactly what type of file format one needs as it has a huge impact on price and more importantly, functionality!