Session 1
Quick first map
1 Paper world map making: STEP-BY-STEP
The easiest way to think about this whole process of digital map making is to relate it to the old and trusted way: ‘paper maps’, using paper, ink, a felt tip marker and some colour pencils.
In the old paper world this is how one would have gone about:
Step 1:
Walk to a filing cabinet or bookshelf and take out a folded map with a suitable scale and place it on the desktop.
In digital jargon: we need to find a specific map file, an appropriate Base-map.
Step2: Open a drawer in your desk, get out a pencil box with numerous colours and take out only a few colours which you need for your specific map. You get out more tools which you know you will need e.g. a rubber, a protractor and a pair of compasses. Your desktop is now getting a bit crowded with all this stuff. You are of course an organised person so you neatly arrange all to the side of the map so that you can quickly chose the right pen or pick-up the right tools. In digital jargon: we need to familiarise ourselves with how the software ‘talks to us’, where the tools are: the ‘interface’
Step 3:
We want to draw (for example) a draining ditch - in a thin, sharp blue line. And so we pick up a pencil. It turns out we only have taken a dark blue pencil out of the box and put that on our desktop but we wanted it to be a light blue. So we open the box and add the light blue pencil on our desktop. Looking at it we see the tip of the pen is blunt, we want a crisp sharp line so we sharpen the pencil.
In digital jargon: we need to set up and adjust a ‘style file’
Step 4:
As we are about to draw our first line on that paper map, our boss comes in and stops us in our tracks. “Wait!, That is an expensive map copy, I don’t want you to ruin the print! Your colleagues need it later as well. Here is a transparency. Please put that on the map and draw your map on top of that.”
And so you draw your map, your information, on that transparency, using all the pens that you need. And perhaps you will create more transparencies as well, all positioned, ‘registered’ over that printed Base-map.
In digital jargon: you are working with ‘layers’.
Step 5:
It took us most of the day to draw this map but we are not quite ready yet. And since we are a tidy person, or our boss insists on a neat cleared desk at the end of each day, we put our pencils back in the box, file the map away again in the cabinet and put our transparencies in a project related binding folder. In other words: all components are stored away separately.
In digital jargon: we need to save our work, the drawings, the layers.
Step 6:
The next day we need to press on with the map: we open the various drawers, cabinets and folders again, table everything, arrange the layers in the right sequence and we are motoring again! Later it turns out we need more field work to complete the map and so, daunted by all this endless filing of the components, we now decide to use a sticky tape, or stapler to temporarily bind the stack together. Or rather (less destructive) we use an elastic band to group all and everything together, the selection of pencils included. It is now easy to file this one bundle and will save a lot of time when we need to work on this map again.
In digital jargon: saving the package of layers & pencils in Map Maker is called a ‘Project’.
Step 7:
In the old paper world, when all the transparencies are drawn and coloured up one would then walk over to the photo-copier to make a few copies. But usually after the first copy, we spot all sorts of tiny things which could be improved: some colours don’t come across all that clear, a font a bit bigger, a typo etc.: back to the drawing board!
In digital jargon: Editing
Step 8:
Once all is adjusted and tweaked to perfection we head for the photocopier again and make the final copies.
In digital jargon: Printing /Publishing
2 Digital world map making: STEP-BY-STEP
We will now go through exactly these same 8 basic steps to make our first digital map.
We will make the map as shown on the front cover. You could try using your own data, but then, when -not ‘if’- things go wrong it might be difficult to realise and analyse what and why things went wrong. So it is strongly recommended to use the course materials and follow the instructions as precisely as possible.
At first we will go rather fast through these 8 steps, with a bare minimum of features to draw and only a few explanations. It will give you a good feel for how things work and it is good for morale to have a first map ready in very little time. After that we will add, refine, and edit the map at which stage more will be explained.
Here we go:
STEP 1: The Base-map
Base layer
To place the map backdrop on your desktop/screen, click on the following tabs/options:
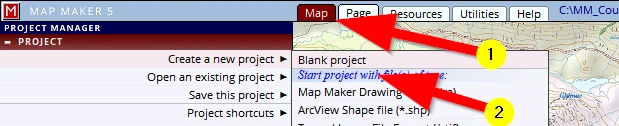
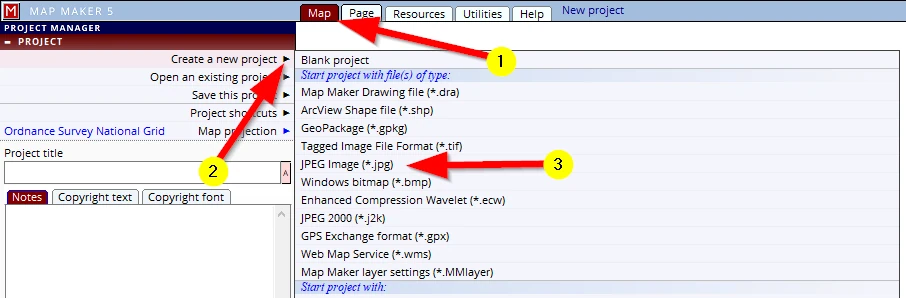
(1) Map Note: MM5 always opens on this tab – the ‘Map view’
(2) Create a new project (click on the little black arrow to open the next menu)
(3) in the section ‘Start project with files(s) of type’, select: JPEG Image (*.jpg)
Browse to:
C:\MM_Course\Available map data\Topo_25K-Base-map.jpg
Select it and in the bottom right of this menu, below the preview OK this choice.
A map will appear on screen. We have now made a start with your first ‘project’.
As a golden rule: if you don’t want to lose what has been done, and don’t want to do that again:
save your work!
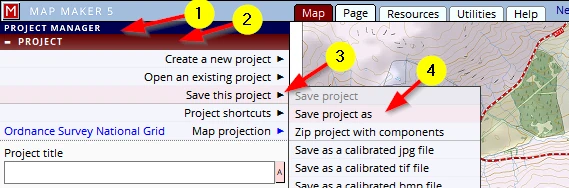
(1) In the PROJECT MANAGER
(2) In the PROJECT header
(3) Click on: Save this project then:
(4) Save project as
In the next menu which opens, please type in the name: My First Map, and browse to the folder:
C:\MM_Course\Training
And save the new file in it.
Note: this is a new project so we can only do a ‘Save project as”. Once it has a name we can use the option ‘Save project’
Later we will learn what, when and how things are saved. From now on just hit the F1 key when prompted to save the project; it is a short-cut to ‘Save project’.
STEP 2: The Interface
In the old paper world we would have a map on our desktop, a few pencils and some tools.
Now, let’s have a look how MM5 deals with these concepts in the digital world; the tools one might need, the layout of the menus, in jargon: ‘the interface’
The interface is how the software ‘talks’ to us, and how we can interact with it. Icons are good and efficient. Some Icons have become internationally recognisable, like these:
...need we say more?
But with digital mapping we need a bit more than these three and then ‘handy icons’ might not be so easy to remember, especially when we are not using the software daily:
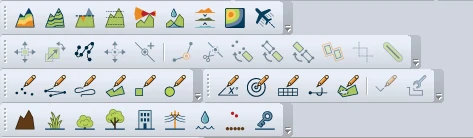

Example typical GIS icons and menus
For this reason MM5 has a different approach: it is ‘understated’ and literally spells things out and uses ‘tabs’ and ‘headers’. These tabs ensure we are not overwhelmed with icon choices and options we do not need (at a particular stage). And further to that, in most cases, below those headers is a text panel explaining the function of that active tool/tab.
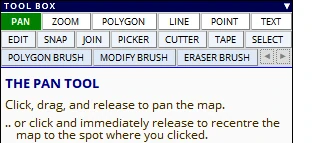
The way the interface looks and changes:
These tabs have a specific colour-coding to emphasise the different sections and functionality of the menus.
For example,
(1) click on the tabs in the top row in sequence: Map, Page, Resources, Utilities, Help
we see that
(2) the headers on the left have different main colours:
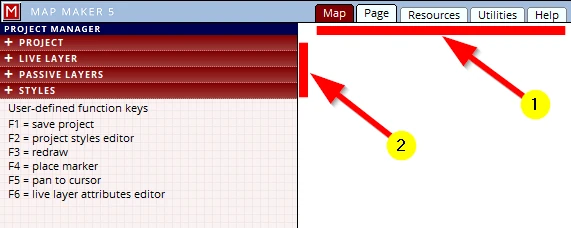




MM5 usually opens the interface on a tab, header which is most likely to be used next, or on the menu last used.
When a header on the left is opened it pushes the other headers further down:
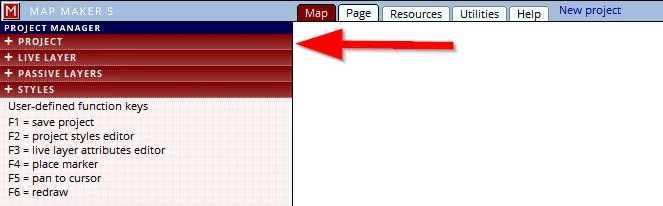
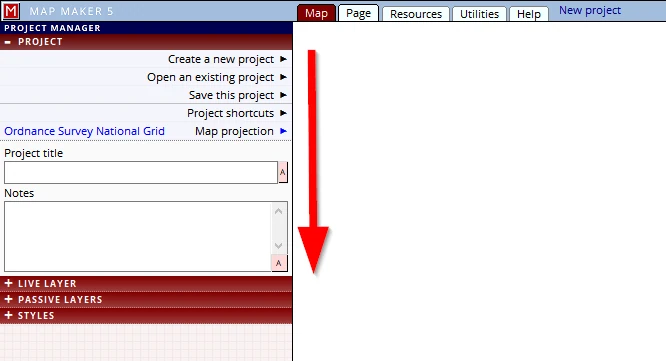
And so it is that when we open MM5 (see image above) that we find ourselves in the tab (top row): Map, and in the PROJECT MANAGER. The header PROJECT is opened, ready for us to (for example) Create a new project, or Open an existing project. When we use a specific tool, the interface on the left changes. A specific menu (in a different colour) with headers will open showing an opened header. It could well be that in a specific scenario we do not want that specific header open, but 9 out of 10, the right menu is opened.
Don’t try the following just now, there is too much to explain, only read & look how the interface works. This is just to get a feel how the software interface changes. We will explain more in detail later.
Observe for example how the interface changes when we have drawn an object and
(1) when we activate the EDIT tool on the left
(2) a series of green headers show and –this is it-: the header which is most likely to be used is already opened (in this case the DEFAULT STYLE header), and that header in turn pushes the last header (ATTRIBUTES) down
(3) At the very bottom we can read some helpful information what this does.
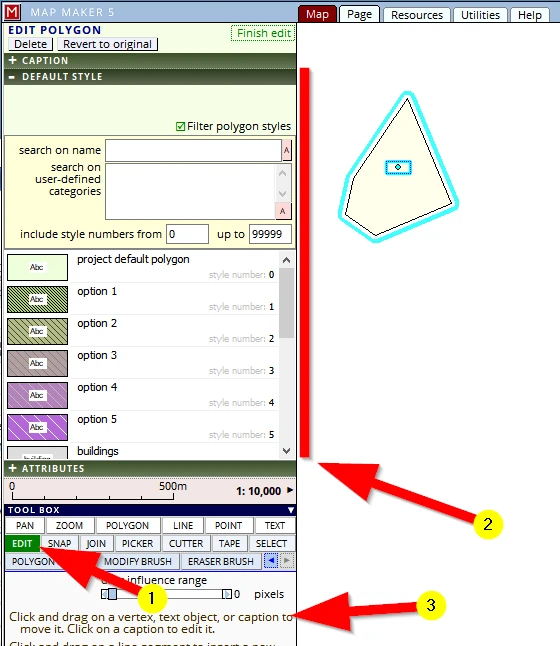
Closing that header we see all headers relating to the EDIT functionality without any further sub menus.

As a first thing we added a base layer. So (still explaining the general workings of the interface and looking at the image below):
(1) We are in the Map view and we can see we have a Base-map on screen.
The PROJECT MANAGER header lists a series of headers dealing specifically with the components which make up a project – these headers are named as such (PROJECT, LIVE LAYER,PASSIVE LAYER, STYLES).
(2) the PASSIVE LAYERS header (when opened) informs us we only have one layer on screen:
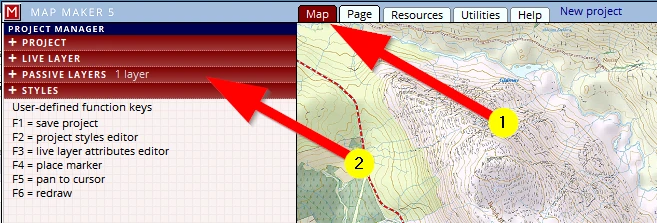
When the PASSIVE LAYER header is opened we see more functions relating to this aspect.
(3) Little black (or blue) arrows behind a function description or in this case behind the layer name indicates there are more menus we can open to use
.
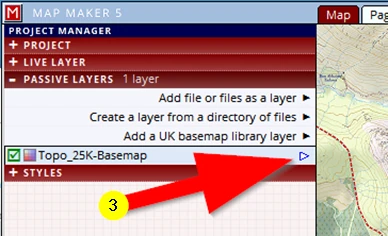
When we click on it a pop-up menu opens, offering the only few options we need at this stage. Some do just as they say (like remove this layer), others will open up more functionality, like the first option layer properties
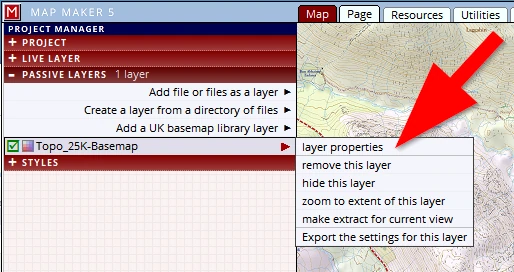
This explained in general the way the software ‘talks’ to us and helps us navigate to the functions which we want to use (and hides the myriad of options which may confuse us at first).
We will now look at the interface in more detail.
A quick run-through of the interface
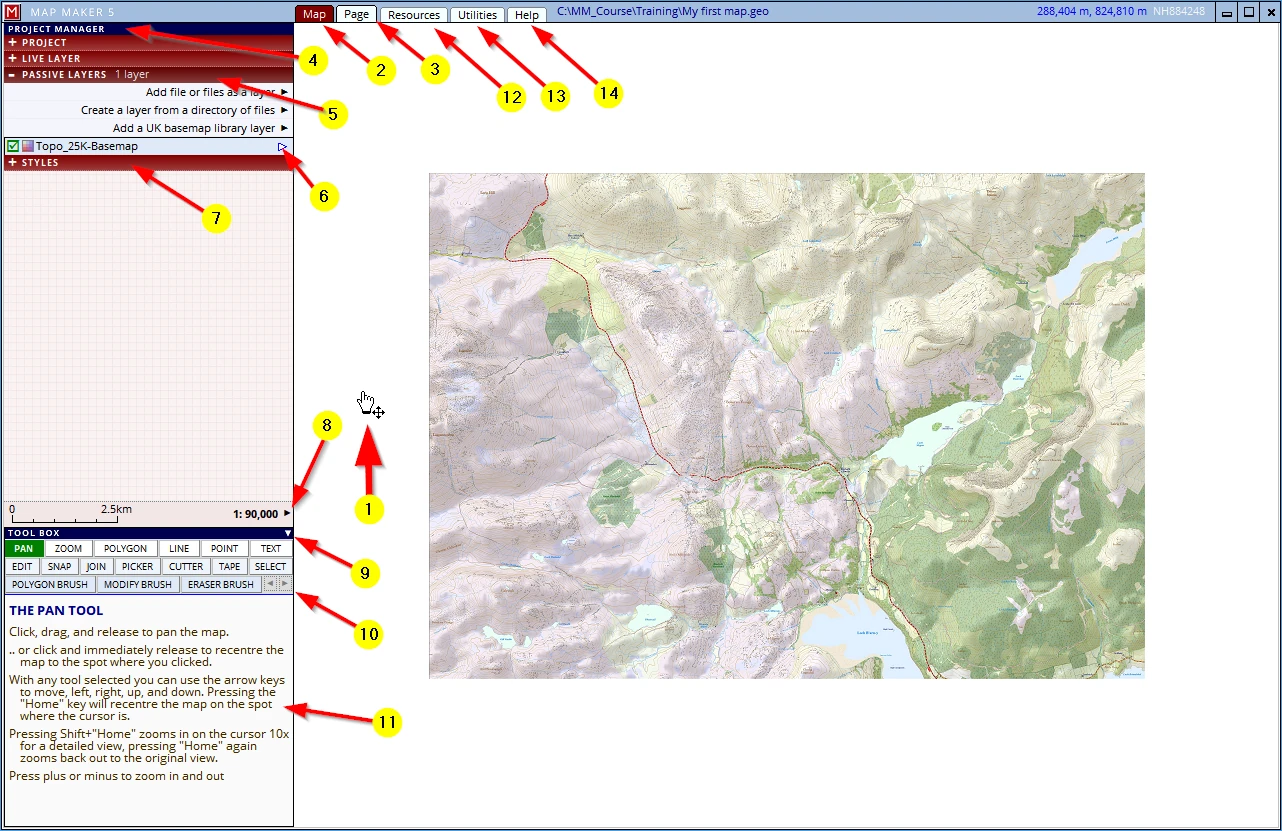
(1) In our scenario we have presently only one layer visible on screen. MM5 has the last tool used, still active. In this example the PAN tool. We can also see which tool is active on the left: the PAN button is green. Tools will always remain active until you change to another (this is important to realise and remember).
(2) All the drawing and editing to create the map is done in the Map tab.
(3) The Page tab deals with printing the map: when all layers are drawn and your work is ready to go.
(4) MM5 calls each map that you make a ‘Project’. To create a new project, save it, add and remove layer etc. is all done in the Project Manager.
(5) A click on a red header opens up a menu below that header, pushing the other headers further down.
(6) Hovering the mouse pointer over the little arrow at the right of this layer header will open up a menu with specific actions for this layer. These actions are those which we will use most often. However, the first option
layer properties will open a new menu to adjust and tweak specific settings for this specific layer.
(7) Your ‘pencils’, the styles, can be seen and changed in this header: STYLES
(8) Click on this little arrow to change scale or for example return to a previous view. Move your cursor over the scale bar and see its appearance change; click on it to get to another scale.
(9) TOOL BOX: This section lists all the immediate tools which we need to draw and edit a map, a click on the little white arrow will reduce its size (to see for example a longer layer or style list). Don’t be fooled in thinking this is all there is to do with MM5! The interface has a hidden, vast array of powerful tools in other tabs (see e.g. 11 & 12)
(10) Undo and redo buttons. How much can be undone depends a bit on the memory capacity of your computer: there is a limit to what it can handle. It is currently limited to physical changes to map objects. Don’t expect wonders and don’t rely on it.
(11) This panel shows useful instructions relating to the present active menu, action, tool, or a menu header over which you hover your mouse so you can read it before it opens. Read them carefully: much to learn!
Note: Most tools and actions a beginner or casual user needs are done through the previously described menus and tools (more or less). Map Maker 5 is a very powerful and complete GIS (Geographic Information System) with many more functions and tools which advanced users or larger organisations will greatly appreciate. These functions and additional tools can be found under the following tabs:
(12) Under the Resources tab you will find a host of specific and additional tools most of which are directly related to the map work at hand.
(13) Utilities; a lot of useful supporting functionality can be found here.
(14) Most of us do not read manuals, but we strongly recommend you do open the Help tab and find your way to the very clear and useful videos showing in detail how some aspects of the software work.
Navigation basics
Pan:
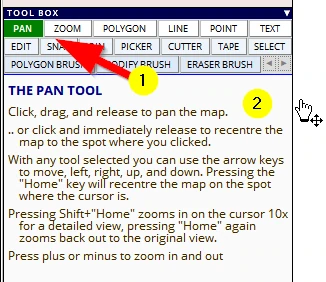
(1) Activate the PAN tool and please read the instructions below it (2) for it explains different ways to pan (like using the ‘Home key ‘ or the ’arrow keys’ on your keyboard).
A ‘quick/short’ tap on the arrow keys of your keyboard makes the screen move a bit into that direction, a ‘long’ press will make it jump quite a bit more.
Master these keyboard navigation tools: they are very efficient and will save you a lot of time.
Zoom:
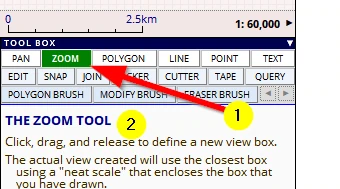
(1) Activate the ZOOM tool and please read the instructions below it (2)
A good way to remember how to use the zoom to box option is this:
Click & hold on the
top left (of the next area of interest) drag diagonally across to the
bottom right of the area of interest.
So:
Top Left move to Bottom right
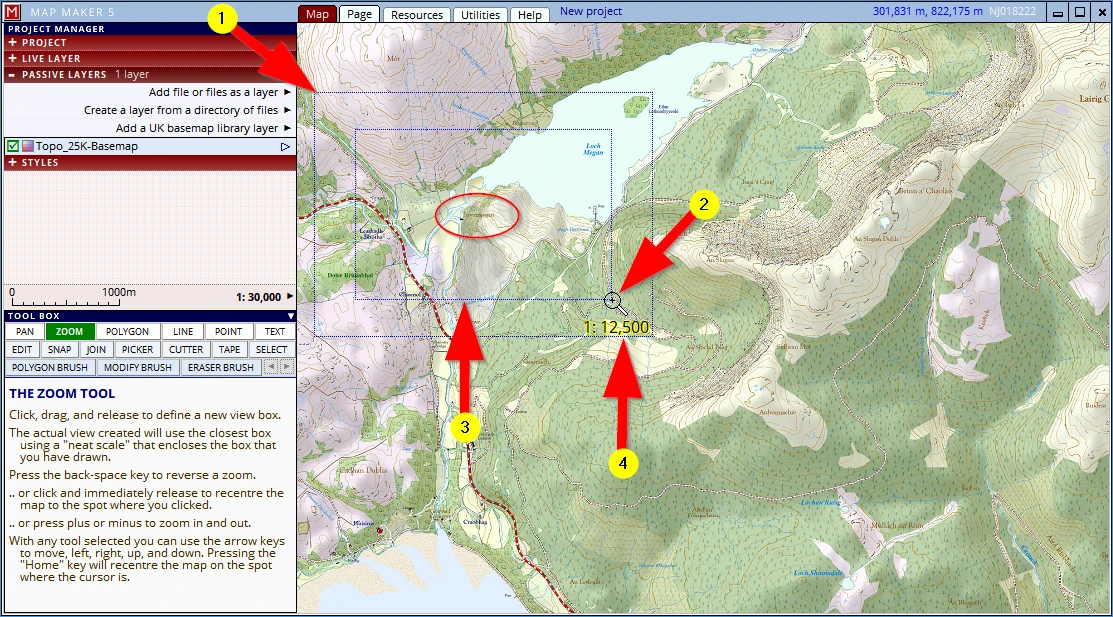
Let’s zoom in on the area marked with the red ellipse in the image below:
(1) with the zoom tool active: Click & hold on the top left corner of the next area to show in view
(2) drag the diagonal to the bottom right until the area of interest is roughly in the centre of the dashed line boxes – then let go of the mouse button
(3) the inner box defines the area you have identified through the mouse movement
(4) the outer box is the area which will fit into the screen view when you let go of the mouse button. MM5 always snaps this view to a nearest proper scale (indicated with the call out. In this case 1:12.500)
So: with this tool we can zoom in anywhere on screen (as opposed to the next options:)
Zoom - alternative 1:
Use the + or - key of your keyboard – a short press will zoom in/out a bit, a ‘long’ press will use a bigger factor.
These controls zoom in or out around the centre of the screen.
Zoom - alternative 2:
Use the mouse wheel. When rolled toward you, the view is pulled up away from the earth, when rolled away from you, you are moving closer to earth – like the stick in an aircraft.
These controls zoom in or out around the location of your mouse.
Scale change:
(1) Click on the little arrow next to the scale
(2) Select a scale
(3) Note: try also these other options (e.g. return to the previous view)
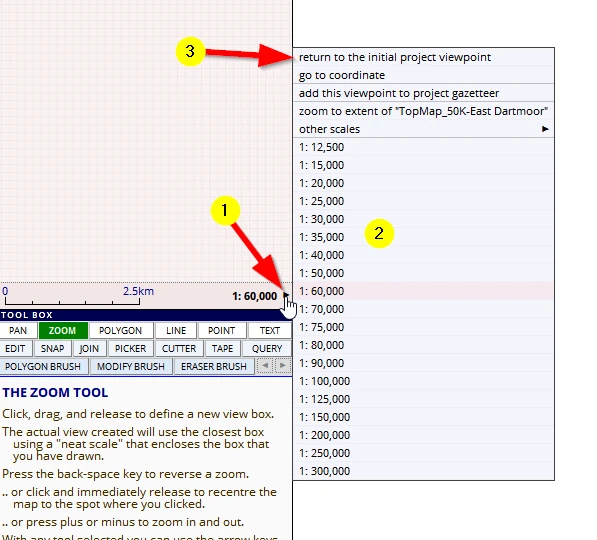
Scale change - alternative:
Move the mouse pointer over the scale bar, ...
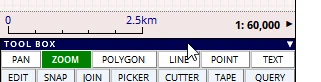
...it will change in appearance:
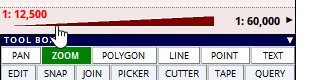
Click anywhere on this red triangle to activate a different scale.
Where ever you move your mouse in the map screen, MM5 will display the location coordinates here:
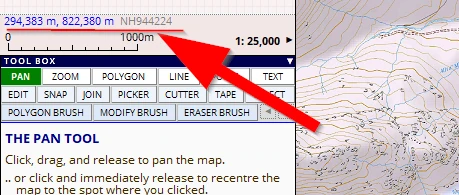
By default MM5 is set to use the British National grid, naturally different projections and other international grid references can be used (see Appendix 5). Since this map is in the UK, MM5 also shows the abbreviated grid reference (in grey).
STEP 3: Our pencil box
The dam to be build is part of a Hydroelectric Scheme. The dam will raise the water to a new level which will have an impact on the environment. It requires a new road, a ‘powerhouse’ for the generator and a transmission line to feed the generated power back to the National Grid.
To map these aspects we need to get a ‘pencil box’ ready:
The style editor
(1) Click on the STYLES header
(2) The project style-set (=your pencil box) is shown with a selection of default styles.
The amount of style-tweaks we can make in MM5 (colours, line thickens, fonts, symbols etc.) is phenomenal: more than you will probably ever need.
(3) Here is an important thing to grasp and remember:
any, all and every map (so that includes the map you would like to make) is drawn by, consists of, only 4 different types of ‘map objects’. They are: Polygons (=jargon for ‘areas’), Lines, Points (=’symbols’) and Texts.
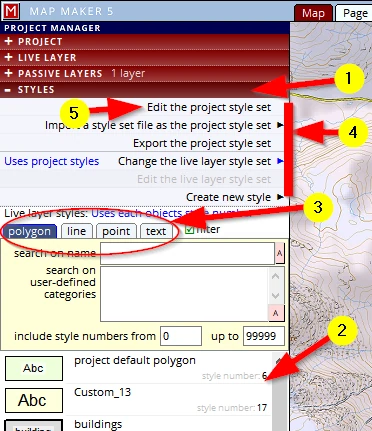
(4) Note that one can import and export an entire style-set so that it can be used in other projects.
Individual style entries can also be imported in other projects. There is even an option so you can save your personal style-set to become the ‘system default’ style-set.
(5) For sheer practice we will change a lot in this default style-set to accommodate our specific needs.
The Project style-set is by default always saved in the ‘Project file’. However, as mentioned we can also save it as a separate file.
Let’s make a few changes:
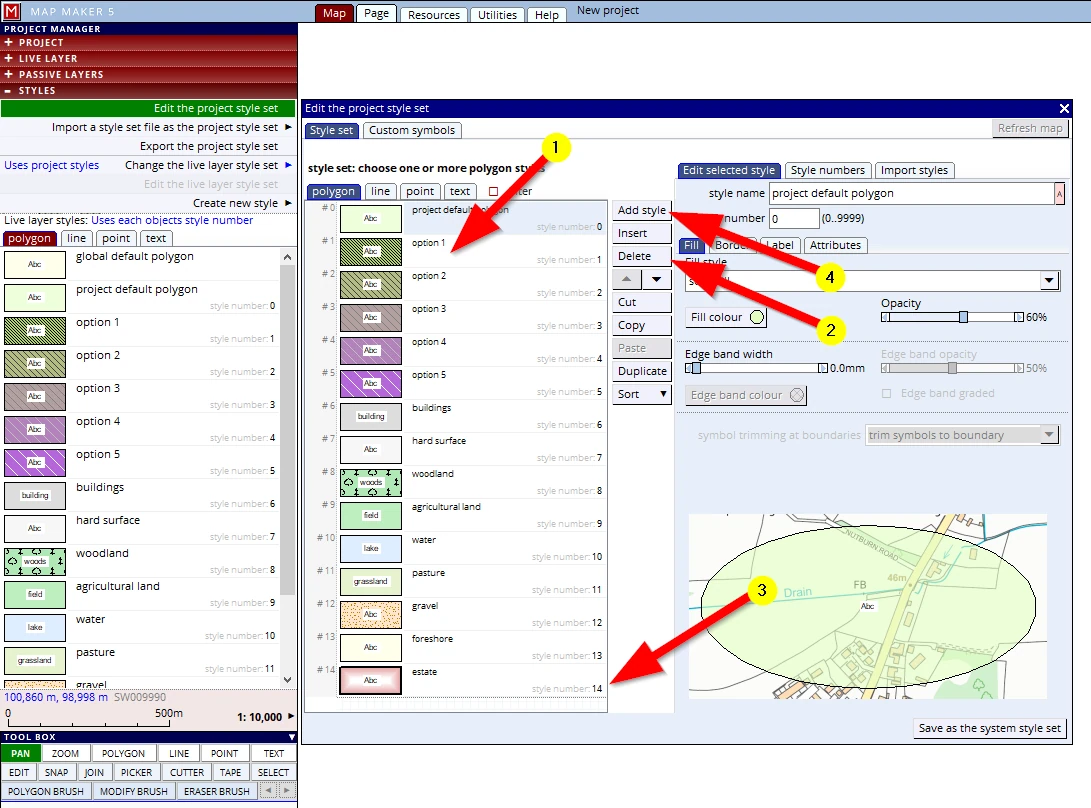
To edit the style set; click on the STYLES header, activate Edit the project style set
The edit menu opens.
Looking at the image below:
(1) Click on the second style entry to select it (‘option 1’; style no 1) and
(2) Delete it. We can repeat this for all styles, one by one. A faster way to delete multiple entries is this: select the first, using the slider scroll down and press the ‘shift’ key on your keyboard and click on the last entry(3): all entries in between will now have a blue shading, indicating they are selected. Now press the Delete button (2).
The pencil box, or rather, the header dealing with areas / polygons is now empty.
(4) To create a new style, press the button Add style
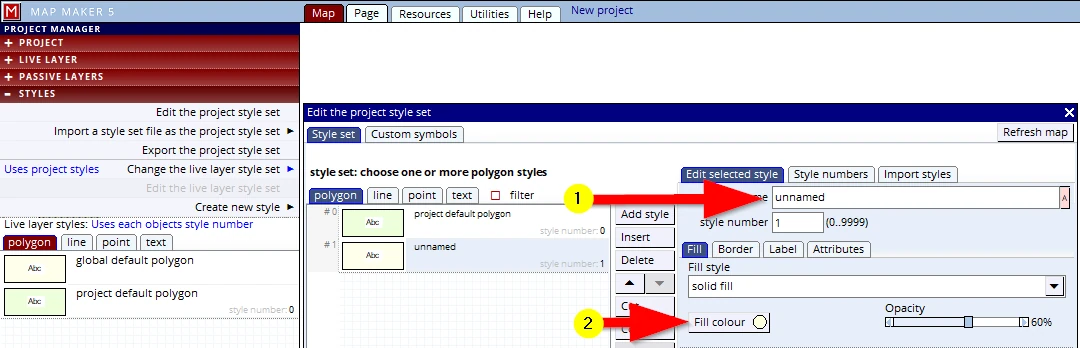
(1) A generic style appears, ‘unnamed’: change its name to ‘Dam’
Note: In general: it is always a good habit to first name new things and only then work with it.
(2) Then click on the ‘Fill colour’.
Note: It is usually handy to leave the very first style entry (Style nr =0 “project default” in place – however, we will delete it
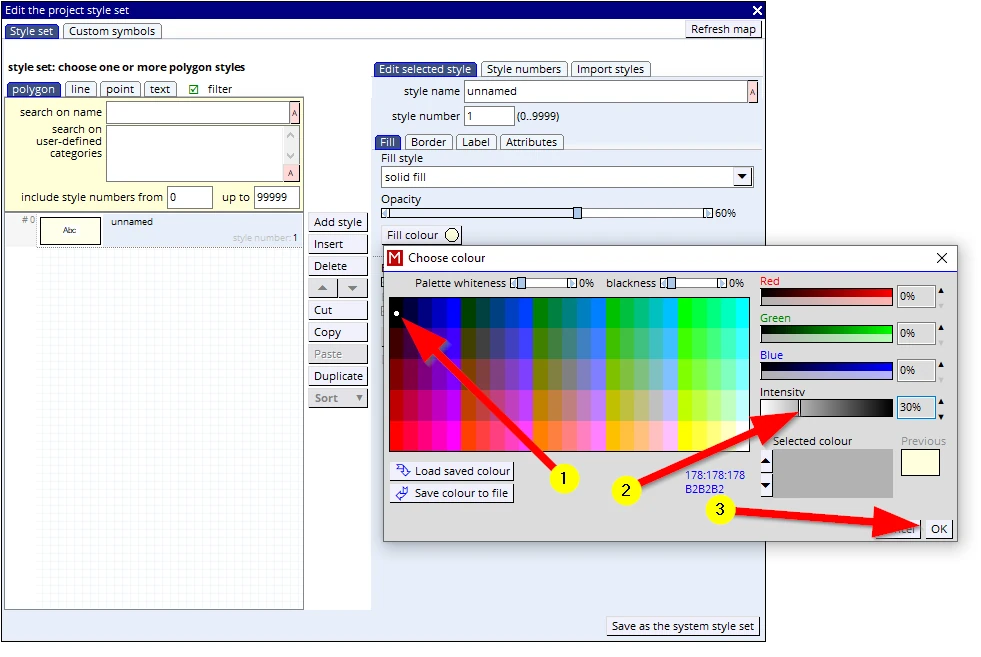
The ‘colour picker’ opens up. Whenever you need to choose a colour (for fonts, lines, fills, etc.), this same interface will open. Later in this course we will explore this in detail. For now:
(1) Click on the black colour (top left).
(2) Click somewhere near 30% on the Intensity slider, this will turn it into a light grey colour.
(3) OK the colour picker menu to close it, but leave the style editor open.
Press F1 to save the project and thus save these changes (a green circle with ‘V’ will show in the centre of your screen). Leave the style editor open for the next entry.
We will do this again and create a new entry dealing with an area, and that means: ‘polygon’.
(1) Add style
(2) Change the style name to ‘New water level’
(3) Opacity slider to 100%
(4) Fill colour
(5) Choose this colour blue:
(6) click OK to close the menu.
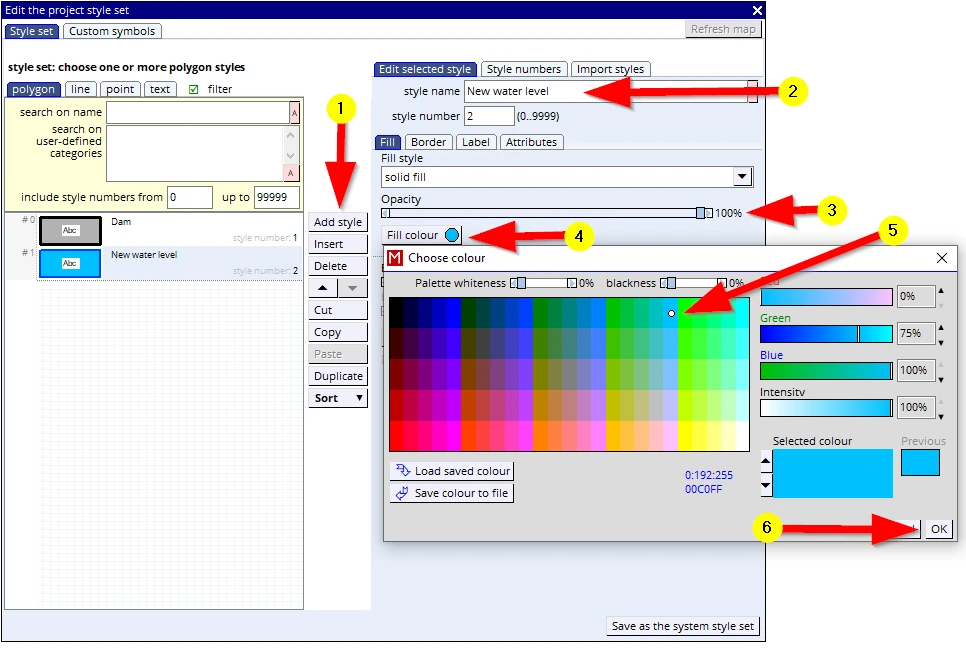
Press F1 to save the project and thus save these changes, leave the style editor menu open for the next addition.
Let’s press on with setting up a style to allow us to draw a transmission line:
Note: Perhaps you have closed the style editor: The style editor can be opened again through the STYLE header, followed by: Edit the project style set. Alternatively press on the F2 key on your keyboard –this too will open up the style editor.
(1) Click on the line tab
(2) This time we will change one of the default styles, click on the style called ‘level 1’ to select it
(3) Rename it to ‘Transmission line’
(4) Change the Line style to a dot dash line
(5) Leave the default colour black
(6) Change the Width to about 0.5mm, either use the slider or click on the value and type it in.
(7) Tick the box: With background line
(8) Change the Extra width of this line to about 0.8mm
(9) Change the Background colour of this background line to...
(10) Red
(11) change the Intensity to about 40%
(12) Click on OK to close this colour picker menu
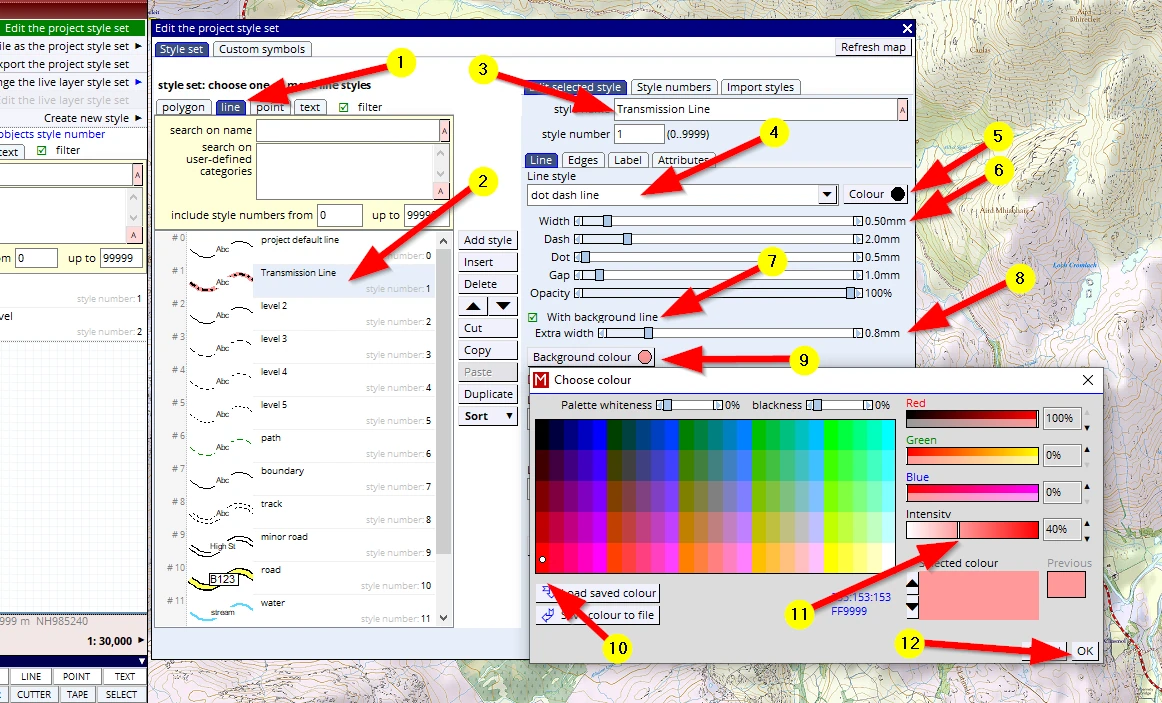
Press F1 to save the project and thus save these changes, leave the style editor menu open for the next addition.
As a map backdrop we have chosen a 1:25,000 scale map. That means that the building for the generator, the powerhouse, will only be a speck on the map, it is therefore best to show this as a (larger) symbol.
We need to create a new style for that:
F2 to open the style editor (if not still open):
(1) Click on the tab: point
(2) Select the style currently called ‘theme 1’
(3) Change the name to ‘Powerhouse’
(4) Change the colour to red
(5) Select as a symbol a ‘solid square’
(6) Change the size to 4 mm
(7) Note the ‘Insertion point’. Leave that as is, but sometimes, for some symbols you may wish to change it to a different location (point & click). For example with a prominent tree symbol or wind turbine symbol. For such, the insertion point could perhaps be best located at the base of the symbol, not the centre as in this case.
Note that each style has three references: it has a sequence number e.g. #3, a name and it has a ‘style number’. Of these three the name and style number are important. The sequence number will change as soon as you move a style entry up or down in this listing using the little black arrows (8). You may wish to change this sequence to get things in a logical order, or perhaps in an order of most used. With the last button we can Sort these.
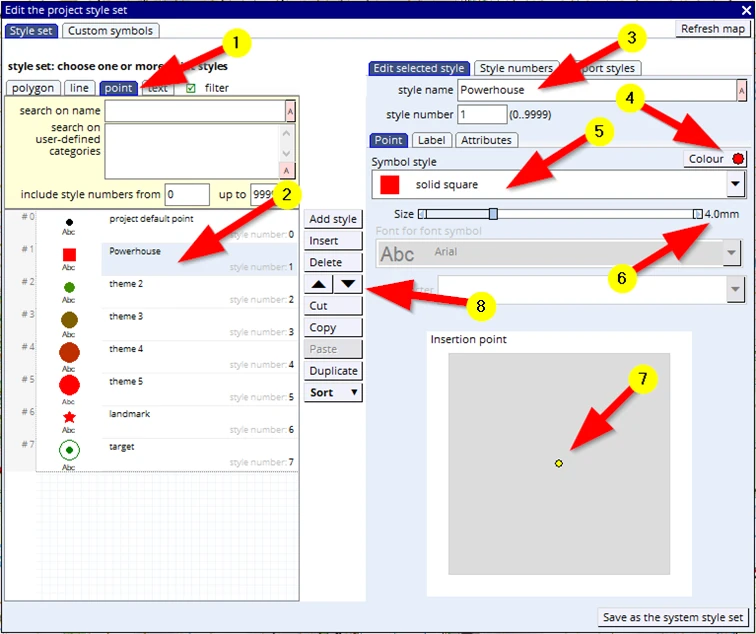
Press F1 to save the project and thus these changes. Leave the style menu open for the next addition.
The project area where the dam will be built has a name so we must have a style ready to write this text on the map:
(1) Click on the tab: text
(2) Select style number 1 (Currently called ‘ROAD’)
(3) Rename it to: ‘Region name’
(4) Change the font if you like
(5) Change the colour to brown
(6) This is a ‘Region name’ so we want the letter spacing to be a bit wider than normal; slide the slider to maximum.
(7) Working with fonts, we have the usual suspects: bold & italic. And for the sake of demonstration, also tick the box with text halo.
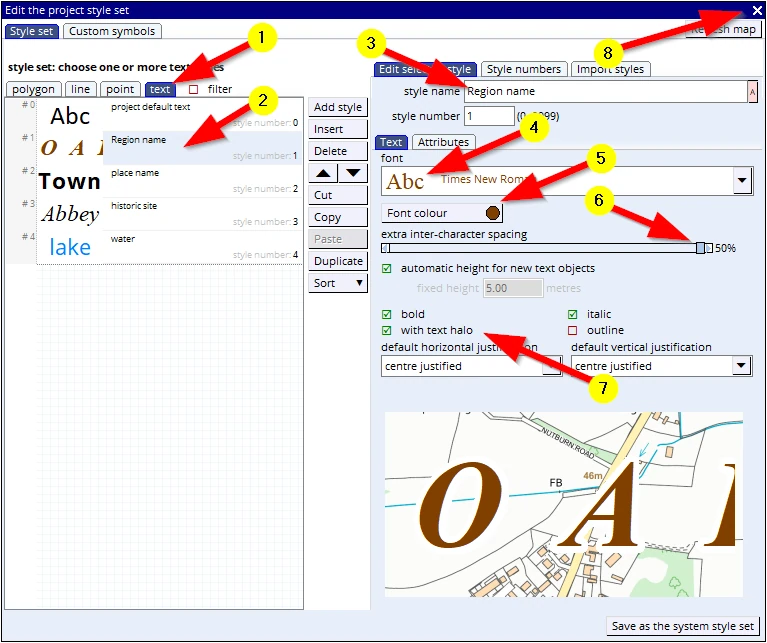
We have now organised enough ‘pencils’ (styles) to draw with so we shall move on to the next step.
(8) Close the style editor down by clicking on the ‘X’ top right.
Press F1 to save the project.
STEP 4: Drawing map objects
In the paper-world analogy this is where one would pick up a pencil to start drawing on the map. At that very moment your boss comes in advising you not to draw on the actual map but to draw on a transparency. In digital speak: this transparency is called a ‘layer’.
We want to create a new layer to draw on. In MM5 there is no button to ‘create a new empty layer’. As soon as you put your pen to paper, start drawing map objects on an empty screen, MM5 will create a new layer for you.
It is called the ‘live layer’. There is a special header dealing with settings for this layer.
It is called a ‘live’ layer because you are working in it. This is as opposed to the passive layers which are saved and (in that state) can not be edited.
With regards to the actual drawing process: we will first explain how things work, only then we will draw features in our map.
The drawing tools
As mentioned before, any and every map (so that includes the maps you want to make), consists of only 4 ‘map objects’.
Looking at a map we can see:
- Areas (Fields, Ponds, Woodlands, Buildings etc.) – so-called ‘Polygons’.
- Linear features (railway lines, roads Electricity lines, etc.) - Lines
- Point features (‘Symbols’ such as Parking area, fuel point, Wind Turbine, etc.)
- and Text (annotations)
So, no matter which mapping software one will use, we can expect to see tools which allow us to draw these 4 objects. You can activate any of these 4 tools, in the TOOL BOX, here:
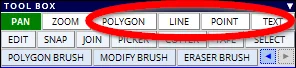
The polygon tool (areas)
Before we start drawing serious map objects let’s first dip our toe in the water:
Activate the POLYGON tool and move the cursor anywhere into the map view.
After having activated the tool, we can see that the cursor has changed: it shows a pointer with a little icon representing a polygon (7).
(1) Is the first left mouse click we make on the map, the start of drawing the shape.
Move the mouse to new locations (2, 3 & 4) and click the left mouse button. A straight line is drawn between each click. The computer registers the exact location where you gave a click. Such a location record is called a ‘vertex’. A straight line is drawn between two vertices
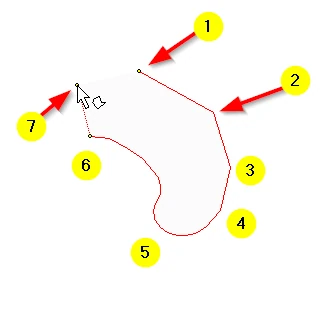
(5) If we want to make a smooth curve we need to reduce the distance of mouse movements and give more clicks.
(6) We may have recorded a wrong location. This can be deleted using the ‘Backspace’ key on your keyboard. Whilst you are drawing we can Pan the screen by pressing the arrow keys on your key board.
(7) Since we are drawing an area, a polygon, we need to close the loop. This can either be done by clicking again on the starting vertex. Alternatively click the right mouse key to inform MM5 that you are done drawing this shape. MM5 will close off the area.
After the right mouse click please note the following:
- we can see that the interface on the left has changed: new and only relevant headers are shown.
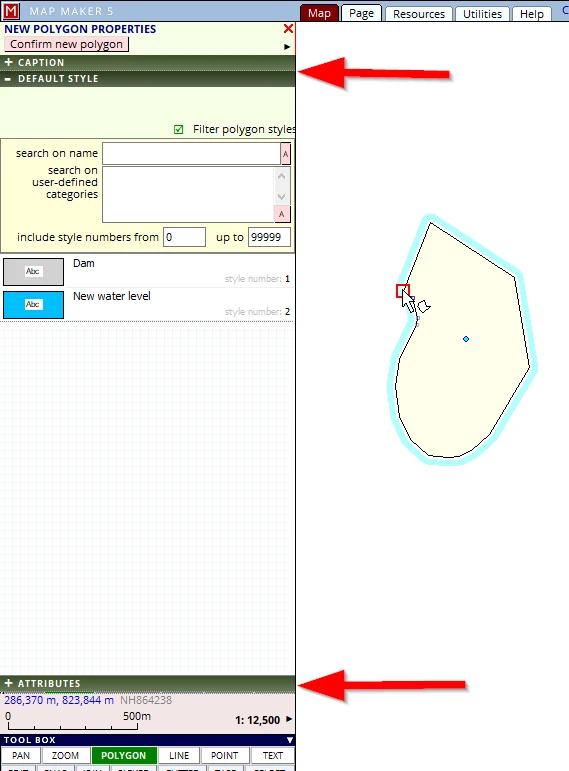
- the object we have just drawn has changed its appearance. The red line is now black, it has a yellow fill and it is highlighted with a blue glow.
All these changes are to focus our attention, and we now need to make a few choices and add some relevant information (if we want).
These option menus will be explained later, for now click on the header DEFAULT STYLE (if not already open).
With the right mouse click (or by a finishing click on the starting vertex), we have informed MM5 we have completed the object we wanted to draw. And now through these menus MM5 is asking us what it is we have drawn. In effect, MM5 draws with a generic pen.
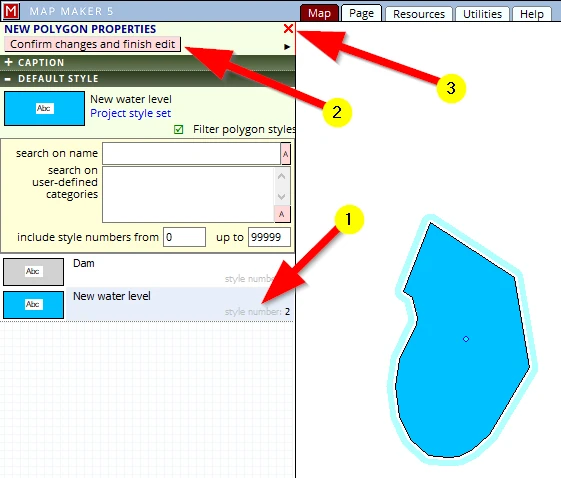
(1) Select style number 2: ‘New water level’
(2) Confirm changes and finish edit
…or …
(3) when not pleased what has been drawn, click on the red cross which will cancel the new object.
It will now look like this:
The all-important principle to remember is this:
We are colouring by numbers.
Your time in pre-school is now paying off!
This concept is important to understand and remember. We are always drawing ‘raw’ data and this is how map data will look like in its simplest recorded state. It is like a ‘wire mesh’, a framework of plain map objects. Once we assign a style number to this object, MM5 then colours in the shape using the corresponding style number in the pencil box, the style file, the one we have just created in this project.
This principle works with all map objects which we draw: polygons, lines, symbols and text. Apart from this style number, there are many more settings we can apply to govern the way MM5 colours these map objects, which will be explained later. But at the heart of it is this very principle: we are drawing raw data. We can also add further associated information e.g. a name of a field, species or an ownership code (called attribute data), which can also be used to bring colours to the drawing.
All GIS and mapping software use these principles:
raw drawing data + attribute data + styling = coloured map
In the above explanation we have assigned a style number after we have drawn the map object. However, more in line with the paper world, we can also select a style before we start drawing.
This is how that is done:
(1) Activate the POLYGON tool
(2) Click on the current live layer polygon style (that is jargon for: ‘this is the current pencil you are holding in your hand’)
(3) Select the style you want to assign to the object that you draw.
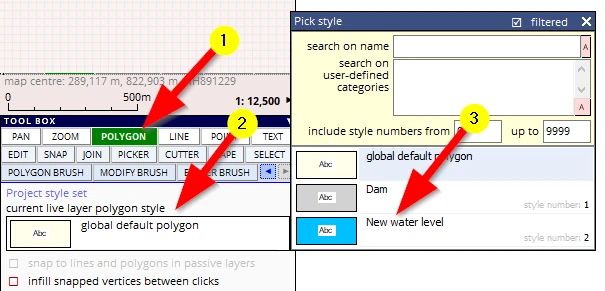
As long as the green headers in the top left of the interface are open (new map object), we can change the style in the DEFAULT STYLE header. At any point we can use the EDIT tool to change things yet again – we will do that later.
Now that we have done a ‘test run’, we will start our drawing proper and draw some of the landscape components involved with our Hydroelectric Scheme.
You may have tried a few shapes, drawing over the Base-map which was on screen.
Since these were probably just some trial objects we need to clear those to make room for our proper work.
There are three ways:
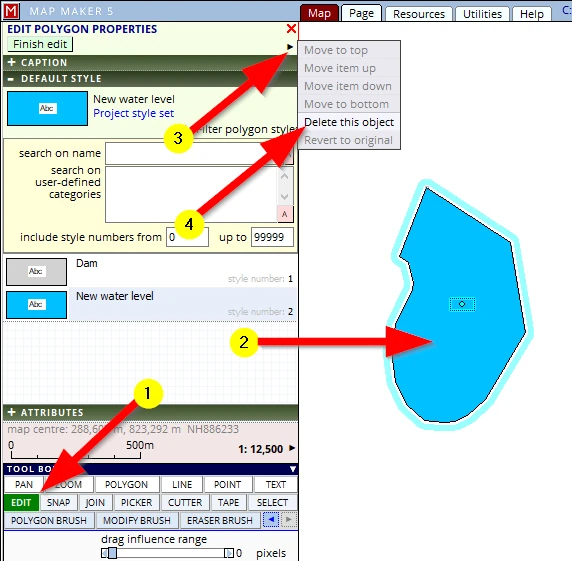
Option 1:
If it is only one object you wish to delete try this:
(1) Click on the EDIT tool button
(2) Click once in the polygon
This will open the EDIT POLYGON menu, in this menu you can then…
(3) Click on the little black arrow to open the next menu.
Note: options in grey are not applicable in this situation
(4) Click on Delete this object
Option 2:
Perhaps you have drawn a few objects:
(1) Click on the header LIVE LAYER
(2) Select the option Clear the live layer
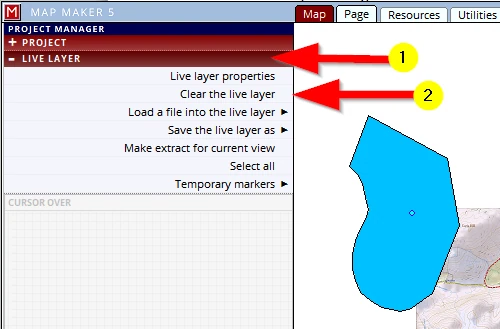
As the name suggests, it will clear the entire live layer with all of its content.
Option 3:
A third alternative to get back where we were is more drastic: we could clear this entire project off the screen and open this project up again from file.
It is more ‘drastic’ because if you have failed to save your project (F1) when prompted, you may lose some of your work. Again, provided you have saved your project at strategic points and intervals, this is a quick way of stepping back in time.
If you are sure you have saved your project after every step so far, to start afresh try:
(1) Activate the PROJECT header
(2) Click on Create a new project, then Blank project - this will remove the existing project and open up a new ‘empty‘ project
(3) Click on Open an existing project and browse for and select C:\MM_Course\My first map.
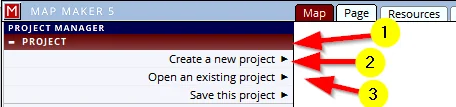
We could however speed this up by going directly to the option: Open an existing project
Note: When opening a project or adding a file, a list with ‘recently opened...’ will show below the Browse button.
Well then, if all is well, we are now looking at the 1:25K Base-map without additional drawings on it.
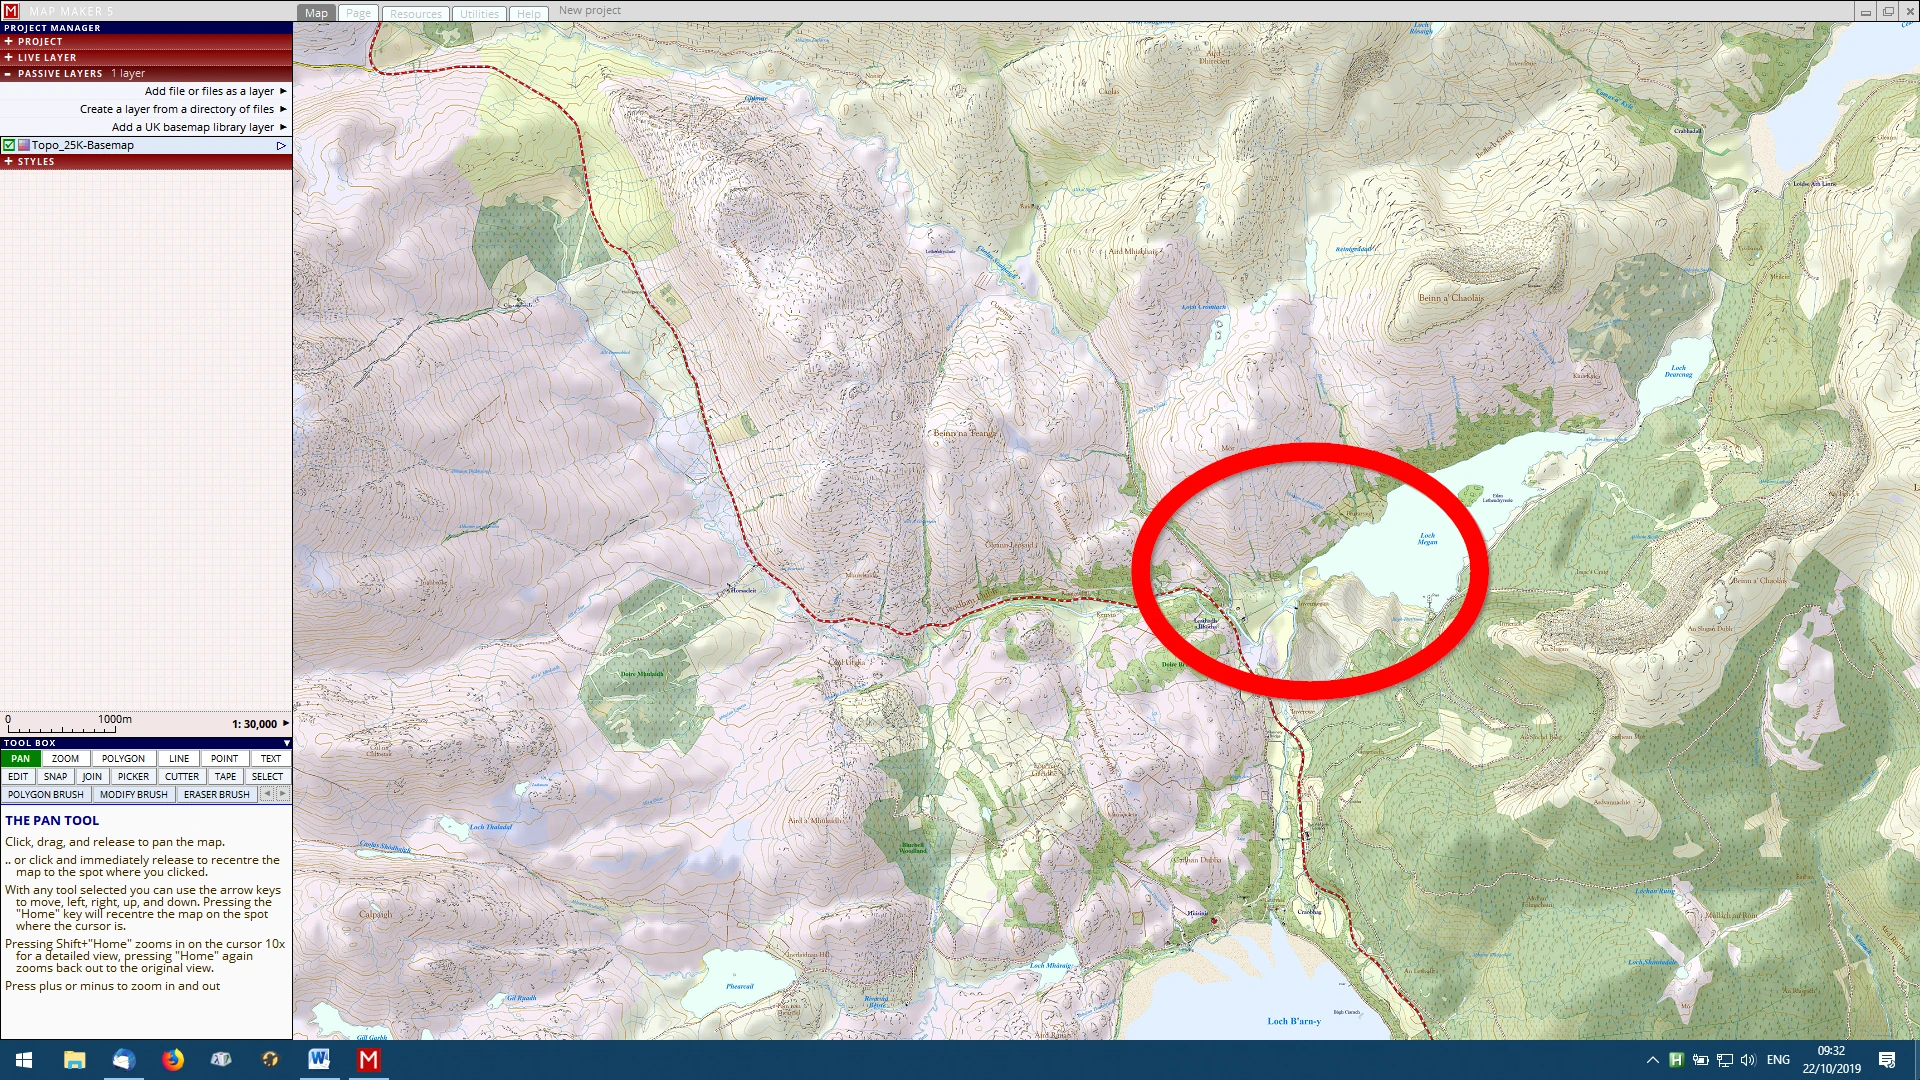
Please zoom in on the area shown below:
Let’s start building a dam!
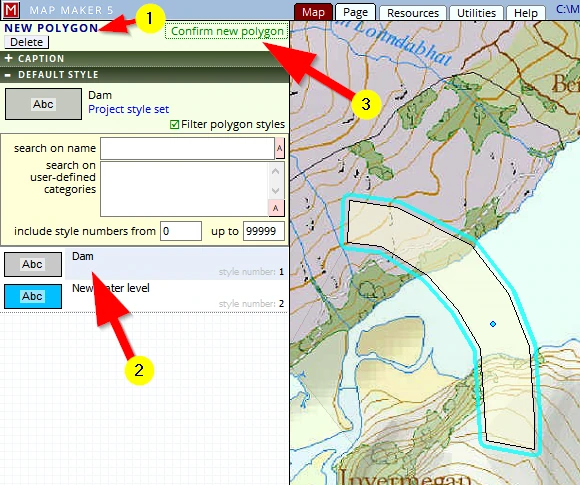
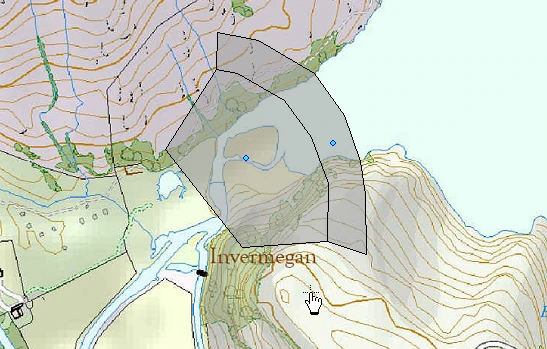
Activate the POLYGON tool and draw the top of the dam – as close as possible to what can be seen below.
Finish with a right mouse click or click again on the starting point.
(1) MM5 will open up the NEW POLYGON menu
(2) Select (and thus assign), the style ‘Dam’ to this new shape
Map Maker shows the drawn object in a default colour (as shown below). It is only after a style is assigned and confirmed that the designed colour is shown
(3) Confirm the new object and these menu headers will close
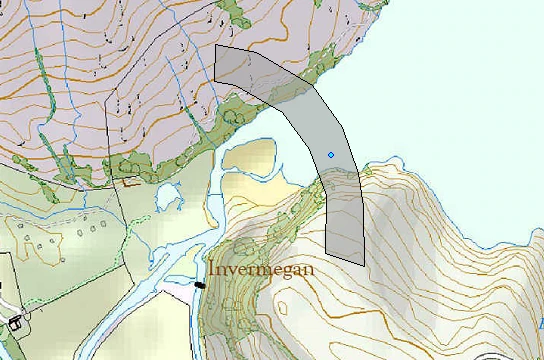
With the polygon tool still active (MM5 tools remain active until a next is chosen) draw a second shape, the base/slope of the dam.
The point tool (symbols)
The dam will have a building to house the generator:
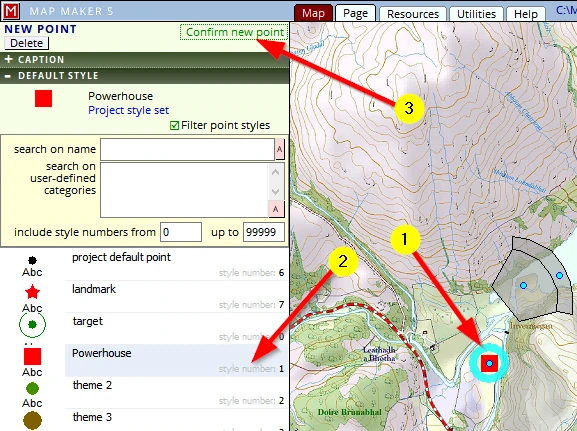
Activate the POINT tool and
(1) give a single click where you want to place the powerhouse (place it as close as possible to this example):
Note: we are in the live layer, and this new object will thus also be placed in this same live layer.
(2) assign the right style number to it, style ‘Powerhouse’
(3) click on Confirm new point.
The line tool (linear features)
The generated power needs to feed into the National Grid: we need to erect a transmission line:
Activate the LINE tool and draw a transmission line in a similar place to as shown.
(1) Start on the Powerhouse with a single click
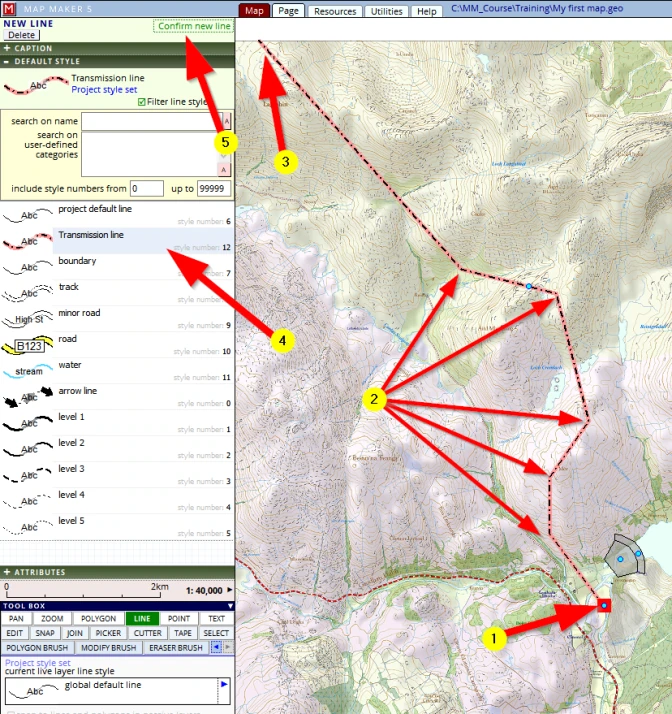
(2) Move the mouse to a new location and give a click Note: don’t forget to use the navigation keys on your keyboard: the Arrows & ‘Home’ key. These keys can be used whilst drawing
(3) After the last click is given, do a right mouse click.
This will activate the NEW LINE menu which will open on the DEFAULT STYLE header (possibly on another header, depending which header you last had in use)
(4) Select the style entry called ‘Transmission line’
(5) click on Confirm new line
STEP 5: Saving our drawing
Looking at the image below:
(1) Note the small blue dots at the centre of each map object. They indicate we have created a new transparency, a new layer and it is ‘live’: you are working in it, it has not been saved yet.
(2) In the PROJECT MANAGER header on the left, a header called LIVE LAYER can be seen. Please open it.
(3) Note: see that a summary is given of what objects are currently in this ‘live layer’. This list shows the type, length, the area and quantities (when applicable) of all that is in the live layer.
(4) Note: this list can be saved as a text file – which in turn can, for example, be opened in Excel.
This is still an unsaved, new layer which means we could potentially lose it. We do not want to draw this again so we will save this new drawing.
(5) to save this drawing, click on the option Save the live layer as
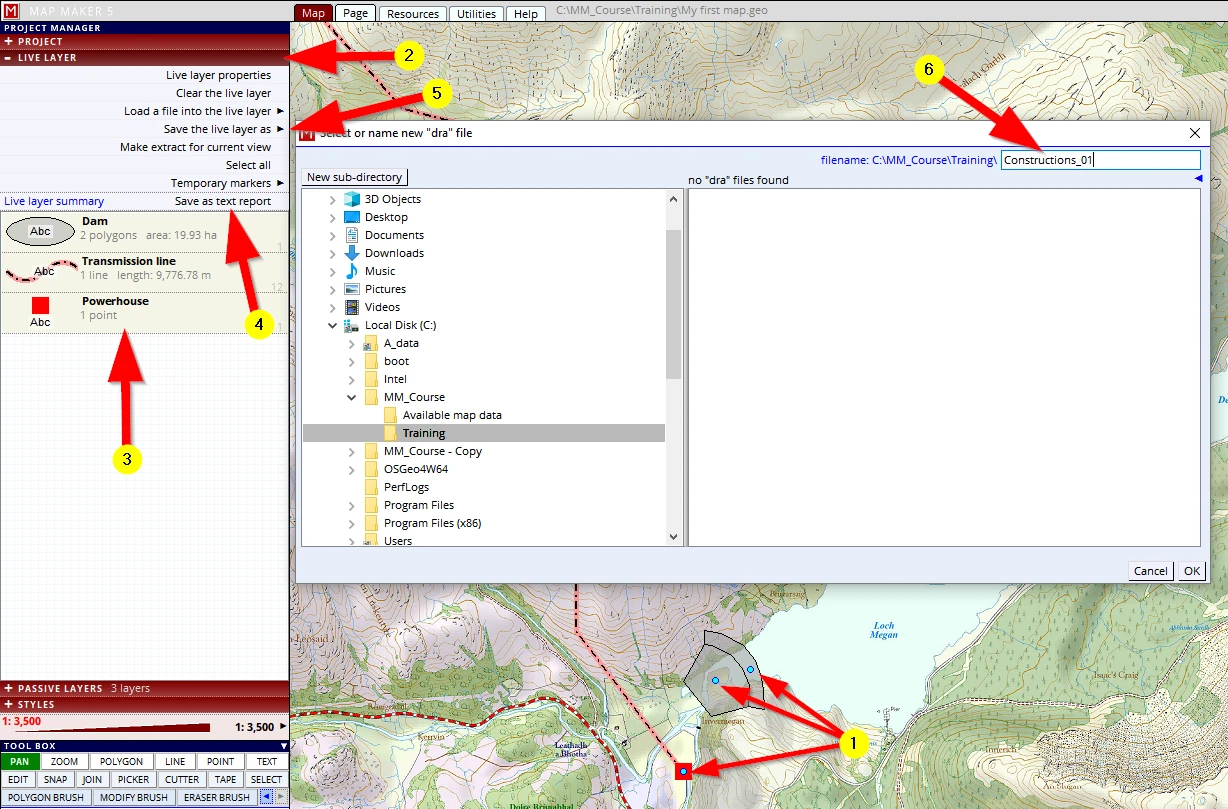
Browse for the folder:
C:\MM_Course\Training
(6) And give it exactly this name: Constructions_01
In the old paper world this equates to putting a sticker on the transparency with its name on it and storing it somewhere in a cupboard. The drawing you just made is now ‘on file’ in the right folder.
Now have a good look.
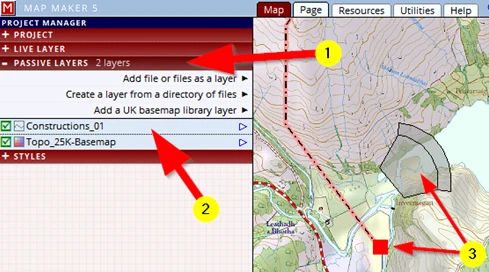
Because you have saved the live layer, the LIVE LAYER header does not show an active layer anymore but when we open the PASSIVE LAYER header (1) we will see that our saved drawing is now listed in this stack of layers (2).
Also note that the little blue dots have disappeared (3) – indicating this is not a live layer anymore.
STEP 6: Saving our project
So far we have created one new layer, but our ‘map’, our project, consists of more components:
1- the Base-map,
2-we have created a style file (the ‘pencil box’) and now
3-we have created a first layer, the drawing of the dam and supporting services.
These different components together make up this one single map (or ‘project’). Our map will grow with many more layers and components and many of these may live in different folders in our computer.
In the paper world, at the end of the day, one would fold up the Base-map again and put it back on the bookshelf amongst the others we may have. We would put the pencils back in the box in a drawer and store the transparency in a folder – just like we have done right now. We will have a clean tidy desktop again.
If we were to close down MM5 now, that is exactly what will happen. Your Base-map was already ‘passive data’ and was once saved somewhere in a folder. And now we saved our live layer into a specific folder and it has become a ‘passive layer’ as well.
But, in the paper world, tomorrow we would need to work on all this map data again. We would need to find all these individual (‘saved’) components and line them all up on our desktop again to get the map back to how it should look like.
That is a lot of hassle, so often in the paper world one would simply put an elastic band around it to ‘group’ the package together for further use.
Putting an ‘elastic band’ around it in the digital world is called ‘Save Project’. We have already done this a few times: we clicked, in the PROJECT header, on Save the project (1, 2) or by pressing the ‘F1’ key on your keyboard.

The file extension is *.geo. It is a simple text file a ‘shopping list’ so MM5 can serve up all individual components in exactly the same way you left it. Saving a ‘map’ is usually a two-step process: saving the drawn live layer, followed by saving the project.
So unlike Word or Excel, saving your work in a GIS usually involves more than just one step.
Some further thoughts and observations:
1
It was advised to give the drawing, the ‘Constructions’ layer, a version number. This is not a MM5 prerequisite, it is our preferred way of doing it. We can strongly advise you to do the same. Things will go wrong or might go pear-shaped halfway through a drawing. If you keep saving your layer every 2 minutes or so, or after each polygon, and give it the next higher version number, you can be assured you do not lose any work (well, hardly any...).
The key steps of saving your work:
Save the live layer (with an increased version number). Save it very frequently. And follow it up with a ‘Save project’. That should be the routine.
Save the live layer (with a version number), Save Project
Hammer this in, get into this good habit. It will serve you well.
2
Once a live layer list is saved, the LIVE LAYER header will have been cleared, it becomes empty, and the saved live layer will then emerge in the PASSIVE LAYER header.
3
But note, MM5 has a special new thing on the go (as opposed to MM3 & MM4), which is that when you save the Project (F1) MM5 will also retain what you have in the live layer (=unsaved work)! This means that when you next open the project, you will have this live layer on screen as well, even though it was not ‘formally’ saved.
It is a safety catch because many novice map makers forget to save their work. The live layer data will be there the next time you open your project exactly as you left is after an F1 project save. It is a safety catch; one should always remember to explicitly save the live layer (after which -and only then- it will show up as a passive layer in the PASSIVE LAYER header).
4
Now, understanding the basics of saving your work, in short: hit that F1 key after any change or addition.
Yes, it is absolutely best to always save your layer with an increased version number, followed by a ‘Save Project’, but of all things, and at least:
F1 (Save project) !
... after every polygon, after 2 minutes, after a style change!
Things will go wrong on you, and it is very frustrating to have to do things for a second time. And when things do go pear-shaped, we can now at least close the project and open it again afresh.
As you get more experienced, you will probably save it a little less frequently, but for now, stick to these routines!
5
Any change in the style file is only saved when you save your project. But of course, MM5 also allows you to specifically export the styles and save them separately as well.
6
With the recommended way of saving our work: a live layer would warrant a specific version number, a ’Project’; would typically not (but sometimes could. Such as during this course for example!).
Now that the dam has been built, the water level will rise. So let’s draw the new maximum water level.
Please activate the polygon tool and draw the shape as seen below. Please do it fairly similarly: don’t make the new Loch any longer nor make it too wide.
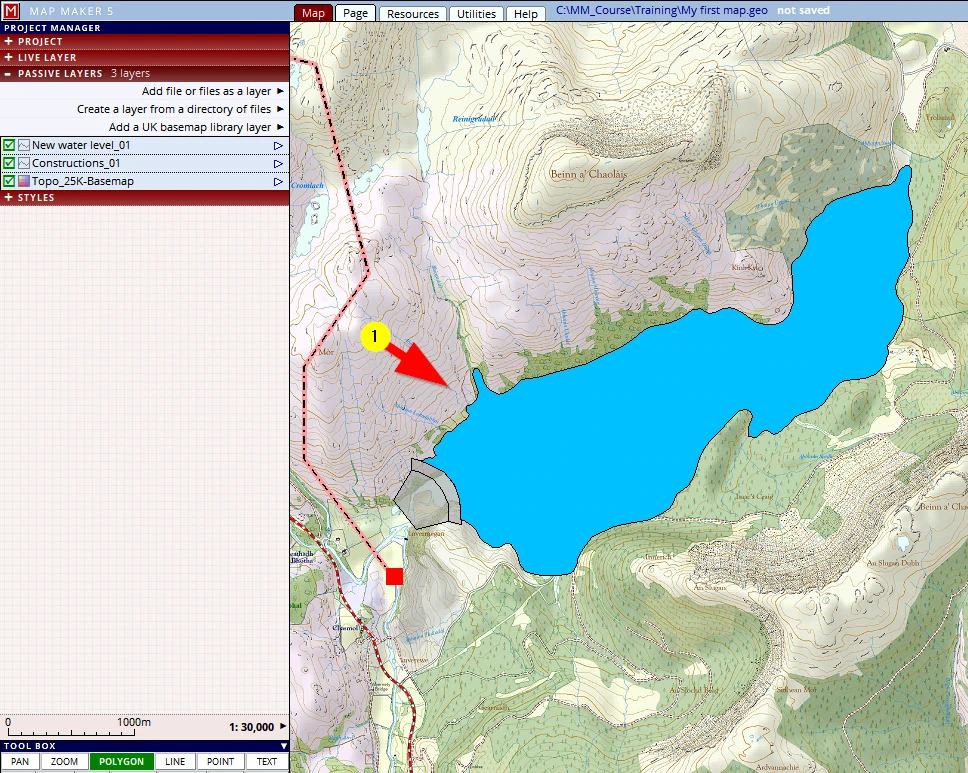
The actual shape and detail is not important: just get a feel for drawing things – in other words, don’t waste too much time on it!
Once the polygon is closed save this layer in the training folder and call it:
C:\MM_Course\Training\New water level_01
Follow it up with an ‘F1’ !
The area, the site has a name, it is called ‘Eastern Districts’. It is appropriate to show this prominently on the map.
The text tool
This is how it works:
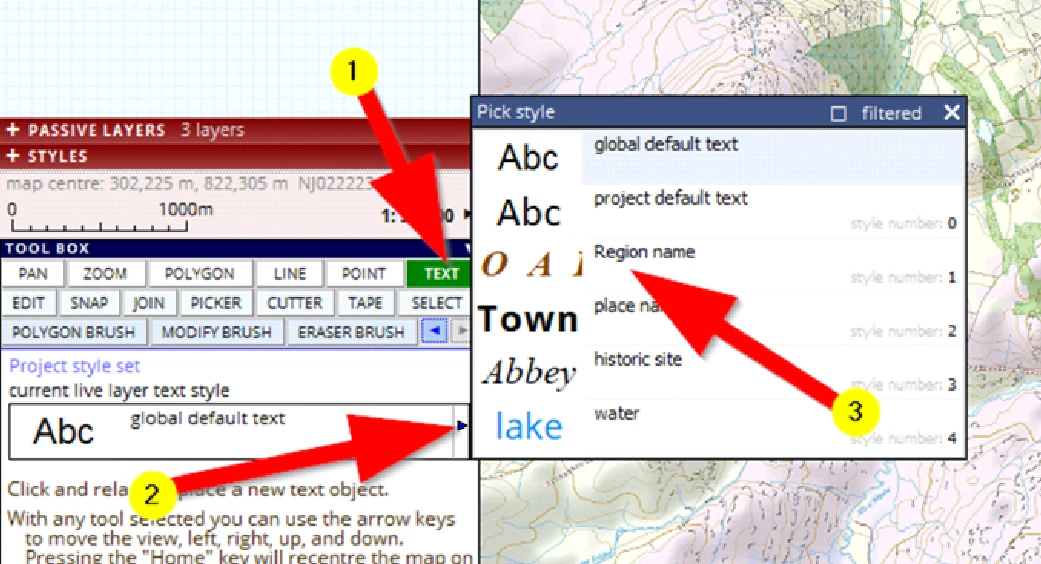
(1) Activate the text tool
(2) Click on the little blue arrow which will open a list of available styles.
(3) Select pen / style no 1: ‘Region name’
Now to put a name on the map:
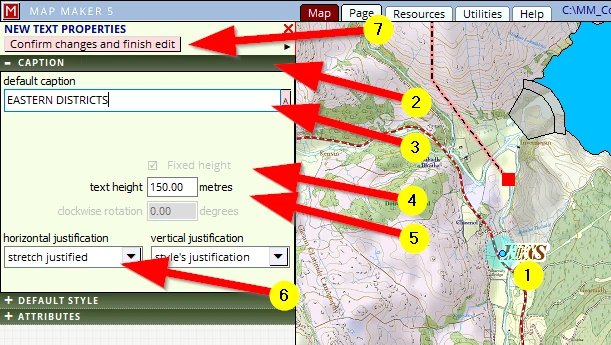
(1) Give a single click somewhere near where the text will have to start
(2) The interface on the left will change; open the CAPTION header
(3) Select ‘New’ and type over it: ‘EASTERN DISTRICTS’ (Note: not SOUTHERN as shown on the front cover!)
(4) Tick the option box: ‘Fixed height’
(5) Change the text height to 150 metres
(6) Change the horizontal justification to stretch justified
(7) Click on Confirm changes and finish edit
The long name is all squeezed, so, now for the fun bit:
Activate the EDIT tool and click and hold on the blue live layer dot.
The text will now show a yellow justification line with blue end point:
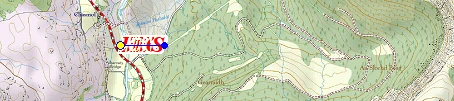
(Click and hold) that end point and drag it to a new location.
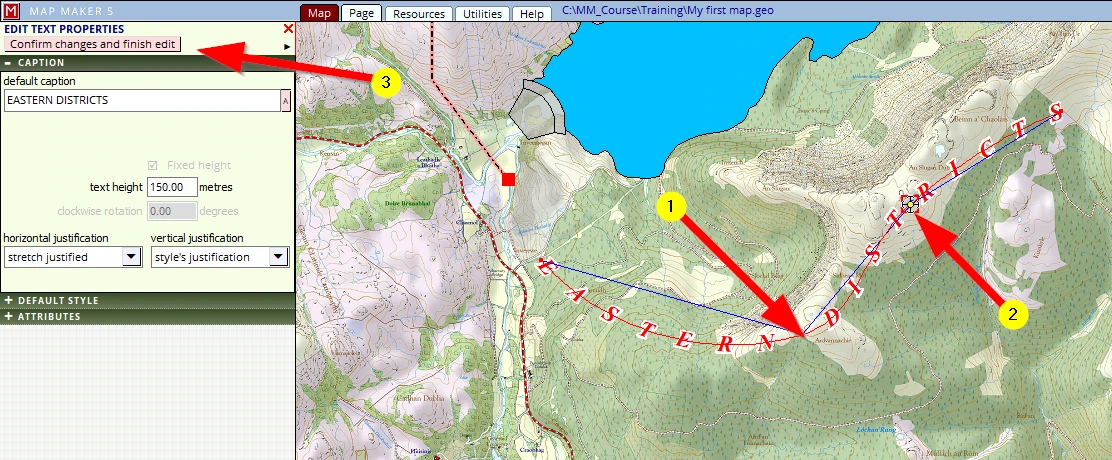
With the edit tool still active,
Click, hold and drag somewhere in the line – it will insert a new vertex and the text will start to curve. In the example below we did this twice (1+2).
(3) Once done, click on the button Confirm changed and finish edit
Save this new live layer:
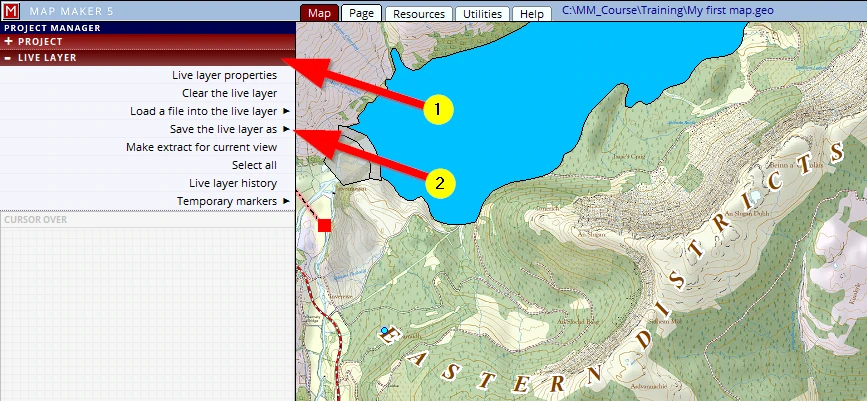
(1) Click on the LIVE LAYER header
(2) Click on Save the live layer as
Then browse to the training folder and give it this name:
C:\MM_Course\Training\Annotation_01
Save your project: F1 !
STEP 7: Tweaking
Of course there is much more that needs to be explained and we will do that later, but to keep the momentum and following the analogy of a paper map production we will press on toward the last step: map publishing.
But first…
So far we have been working, drawing the map in the Map tab. To print this map we need to go to the ‘Page layout’. Please click on the Page tab.
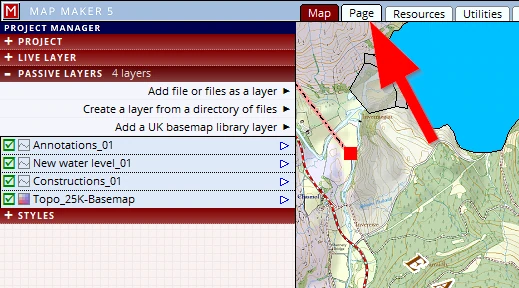
The screen will have changed into something like this:
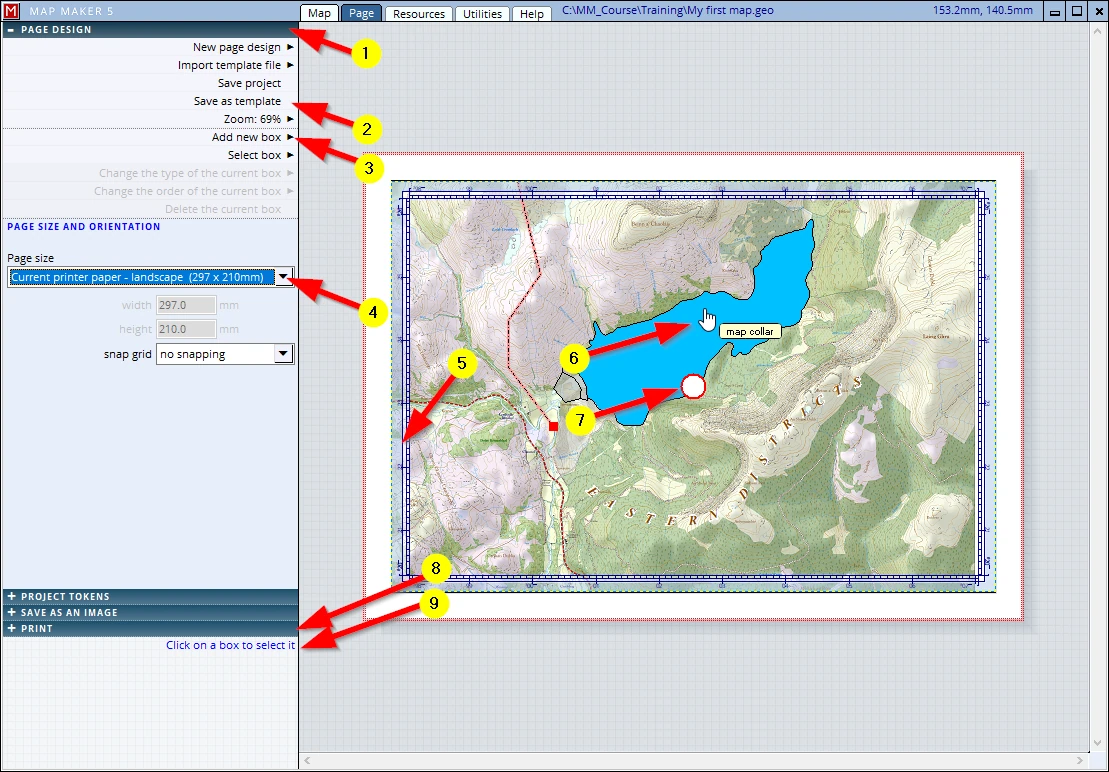
We are now looking (as it were) at a sheet of printing paper (by default A4 Landscape) and this interface allows us to design a good map layout.
Note (in the image above) the following:
(1) Just like in Map view, the interface works with headers which open more option menus, pushing the other headers down. In Map view the header colours were red, in Page view these are blue.
(2) This ‘Page design’ is called a ‘Template’ and as that name suggests, it is a template, which means it is intended to be used more often. You can save this design, and re-use it in other projects.
(3) This map design uses ‘map furniture boxes’, currently only one box is shown (the map collar) but we will add a few more later (like a map title, a scale bar etc.).
(4) This lists the current paper size: leave that as is for now (A4 Landscape).
(5) The map is shown in a coordinated, transparent border, or ‘collar’. We will change the size of this box and its appearance to our liking.
(6) This shows the location of our mouse. It has a call-out: “map collar”, explaining the type of ‘box’ the cursor is in.
(7) To PAN the map within the map collar please move your mouse into the white circle in the centre, click, hold and drag it into a different position.
Note: Unlike MM4, this PAN changes the ‘Print view’ only, not the ‘Map view’
(8) We are gearing up to PRINT
Note the header above it: that is where you can save the map to a PDF file – we will do that later!
(9) Hover your mouse over any header, and below the last header you will get a help panel with some useful tips and instructions.
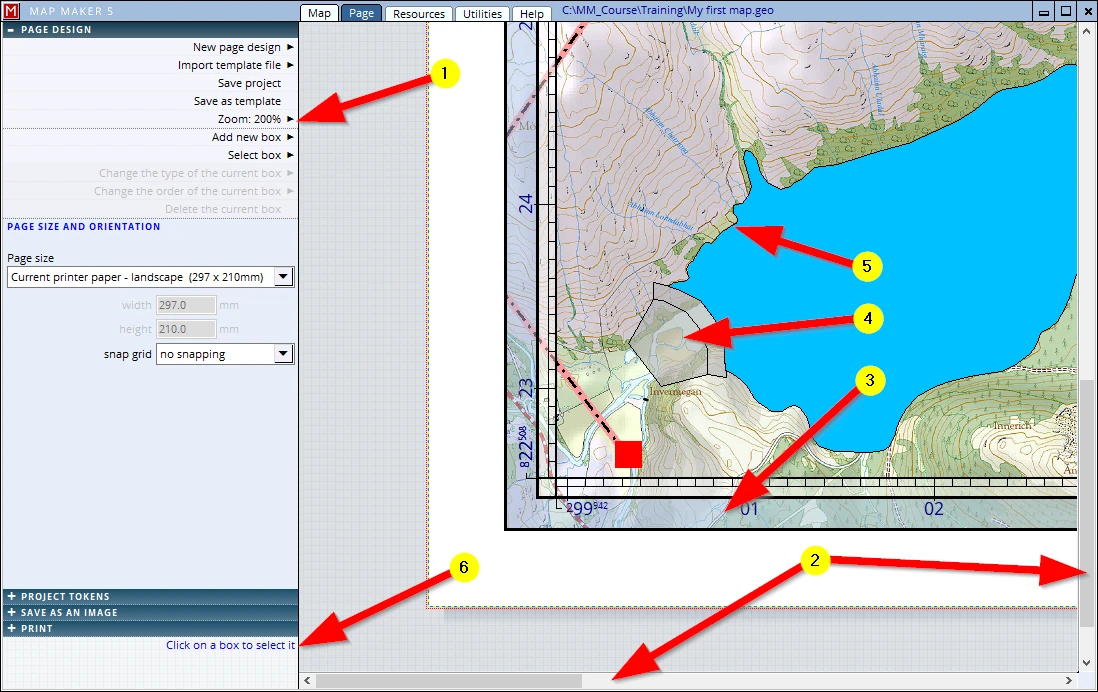
In ‘Map’ view the drawing looked fine. We are now in ‘Page’ view and we now see our map within a particular coordinated map collar and we are about to print this map. But to be sure we don’t waste any ink and paper we will have a close-up look of what actually will be printed:
(1) Zoom in to e.g. 200%
(2) Navigate (up or down, left or right) through the map using these two scroll bars and observe the finer details of the map up close.
Instantly 3 things stand out which we don’t particularly like and could do with a ‘tweak’:
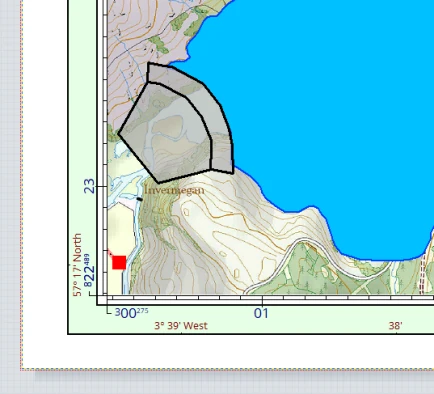
(3) Tweak 1: the map collar is quite elaborate, showing coordinates etc. - at this stage we only want to see one simple, single black line.
(4) Tweak 2: the fill colour of the Dam is transparent and thus the old topography still shines through - it should be set to ‘opaque’.
(5) Tweak 3: On a map, usually water has got a blue outline, not this black outline.
So we need to change, ‘tweak’, these things.
Since we are still in ’Page’ view let’s have a look at that collar first to see what we can do.
(6) The ‘Help’ panel informs us we need to Click on a box to select it, and so we shall!
Tweak 1:
After a click in the main map box the interface will have changed. In this menu we can now change all sorts of settings related to the map collar. At this stage in the course we will keep things simple and only change the Collar type:
(1) This tells us which box we have selected - “CURRENT BOX: map box”
(2) Click on the Collar tab, for that is what we would like to change.
(3) We can change the opacity here (as well as the colour and widths) – change it to 100%.
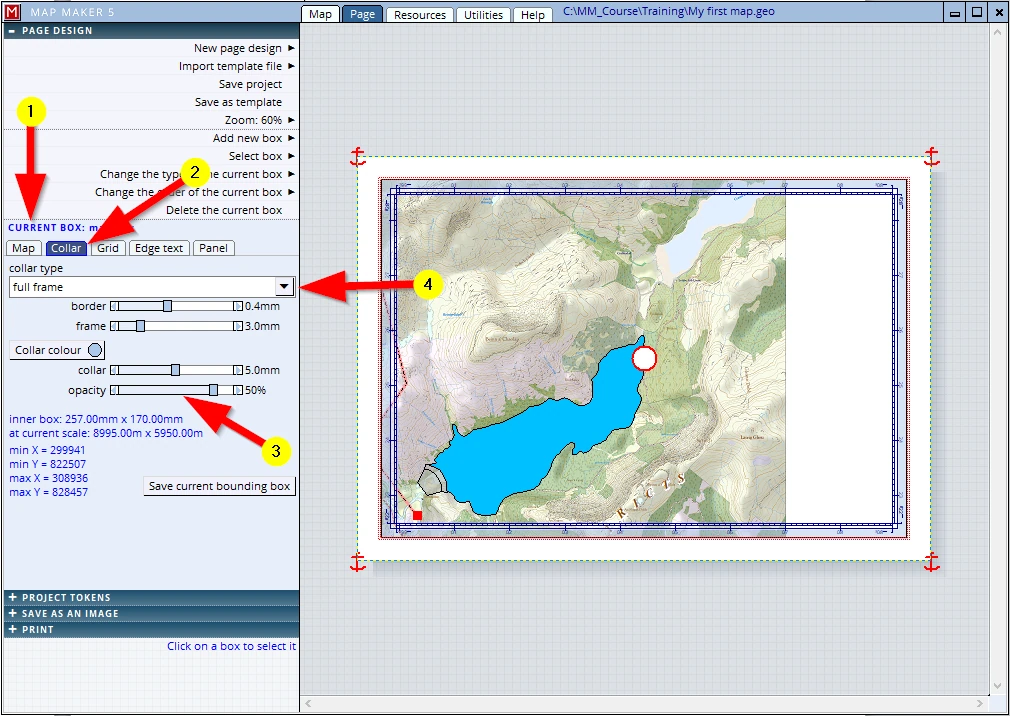
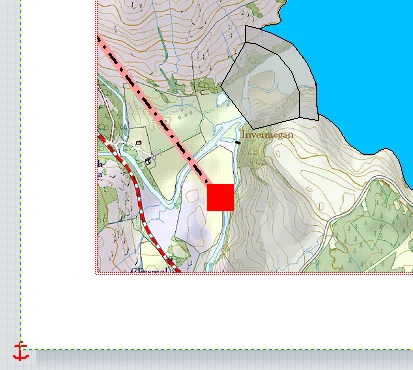
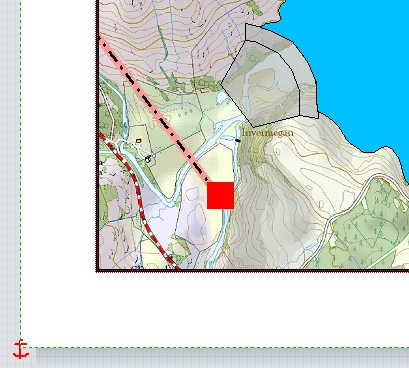
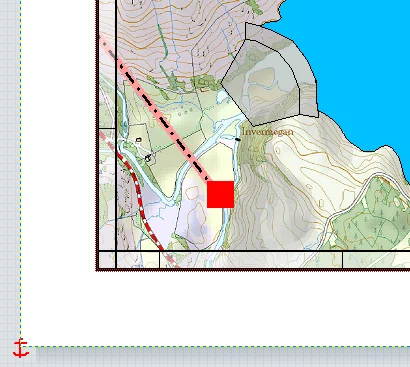
(4) The collar type can be changed here.
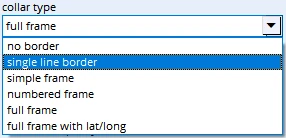
Please select the option single line border.
Note: Below we can see what the other options look like.
This is how all these options look like:
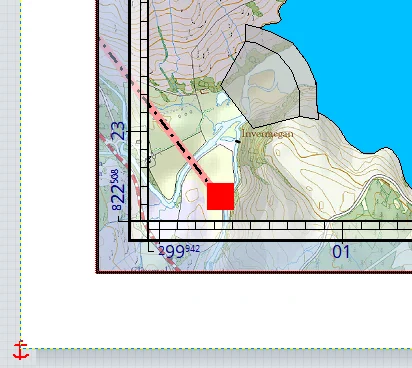
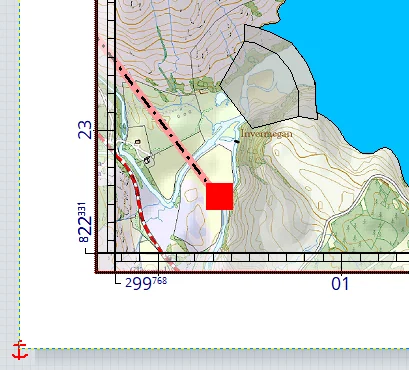
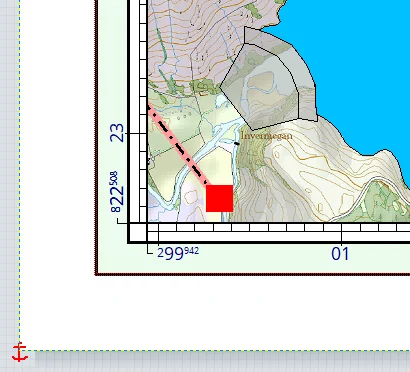
Tweak 2:
We wanted to change the opaqueness of the fill colour of the dam.
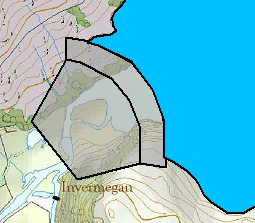
These are changes in the styling, and that must be done in the project style file.
We are currently in the Page tab. To access the style editor and change these aspects we must do the following:
(1) Change the view to the Map view
(2) Click on the STYLES header (alternatively press F2)
(3) Click on Edit the project style set
(4) MM5 will remember the last object type edited, we want to edit a polygon style
(5) Select the style ‘Dam’
(6) Move the Opacity slider to 100%
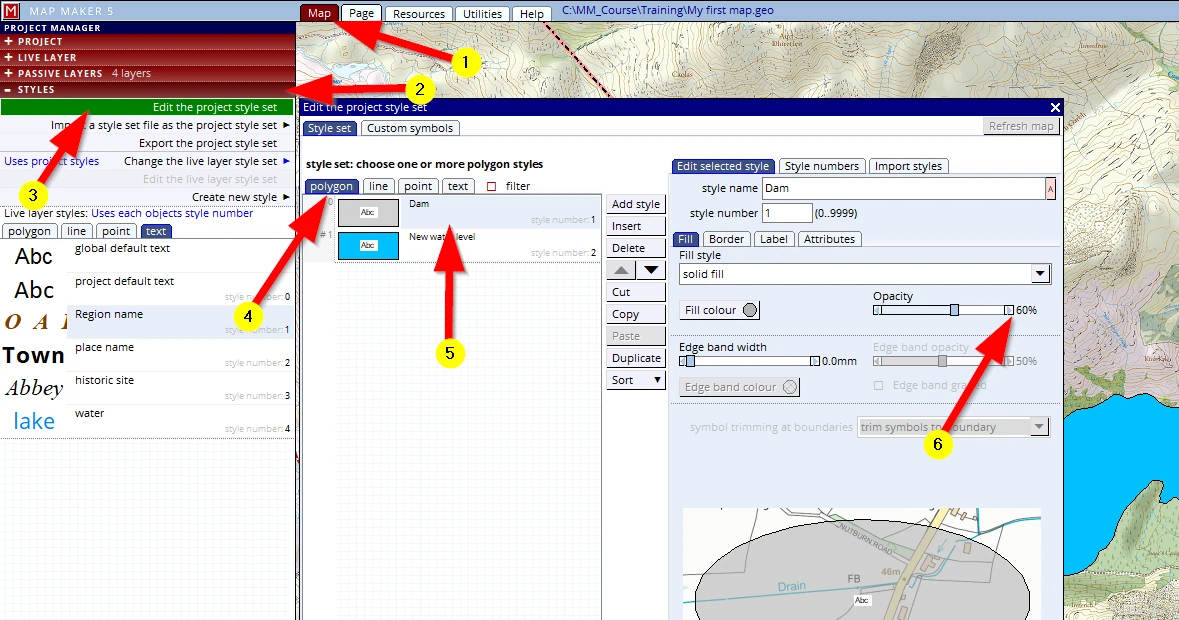
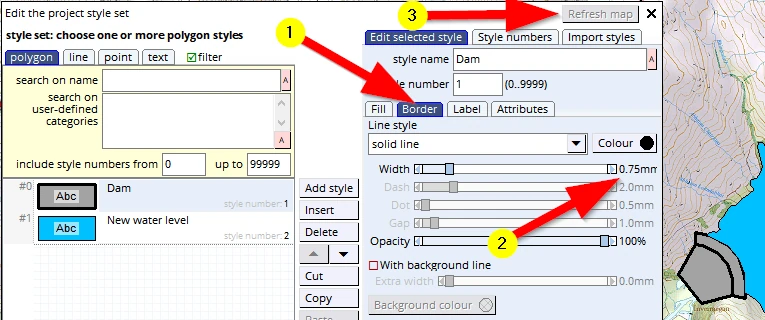
And whilst we are here, we might as well give the polygon border a slightly thicker line width:
(1) Click on the Border tab
(2) Change the Width to about 0.8 mm
(3) Click on the Refresh map button to see the changes take effect in the map view.
With this menu still open:
(1) Click on the style ‘New water level’
(2) the menu on the right will remain open on the Border tab, change the colour to a dark blue
(3) Change the border Width to 0.6mm
(4) Refresh map to see if these changes are acceptable.
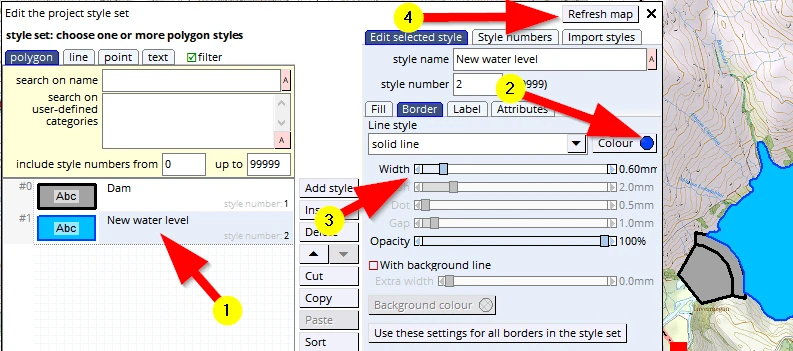
Close this menu (the “X’ next to Refresh map) and save your project: F1.
This is exactly what we had in mind, however...
Tweak 3
What we now see is this:
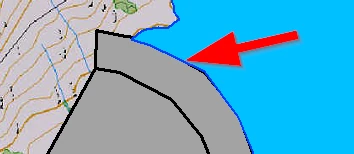
The blue water line is above the black dam line.
It is not a mistake in any of the style setting but cartographically speaking it sends the wrong message. An observant map reader may think that water is now spilling over the dam.
Naturally the water level will be below the rim of the dam, so we would want to see the black outline of the dam polygon rather than this blue water line.
This can be changed, and it is an important concept so take note:
This has to do with the sequence of the layers in the layer stack.
We drew the dam first (in the live layer) and saved that layer so it became a ‘passive’ layer. Then we drew the water level, saved that layer, and for that reason this last layer lives on top of previous layers.
It is just as in the paper world: one can only draw on the transparency which is on top. To draw on any other layer/transparency, one would have to pull it out of the stack (all layers above it move down a slot) and the transparency to draw on would be placed on top. And when saving it, it remains on top.
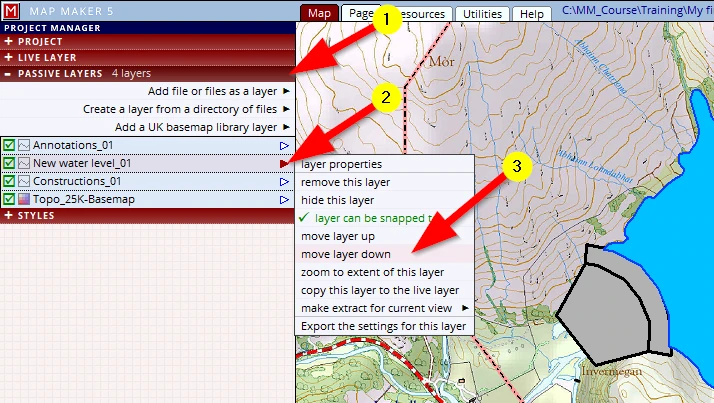
We need to reshuffle the sequence of these ‘passive’ layers:
(1) Click on the PASSIVE LAYERS header
(2) Click on the little arrow of the layer you want to move. It opens up a new menu
(3) Click on move layer down
Note: alternatively click, hold and drag this layer into the right position in the layer stack.
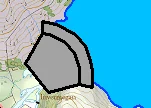
Once done the screen will automatically refresh and we can see we have stemmed the tide!
Don’t forget the all-important: F1 – Save project!
STEP 8: Publishing the map
Our map is almost ready to be published. During the drawing process we have zoomed in an out quit a lot and it could be that your map by now is not properly centred:
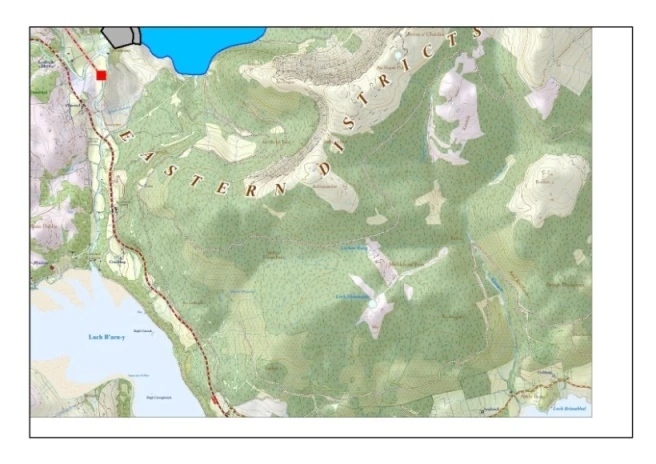
Adjusting the print/map view
Whilst working in the live layer, in the Map tab we have zoomed in and out and probably moved the map off centre. In our example, now that we are in Page view we see that part of our print will even be blank (see example image above).
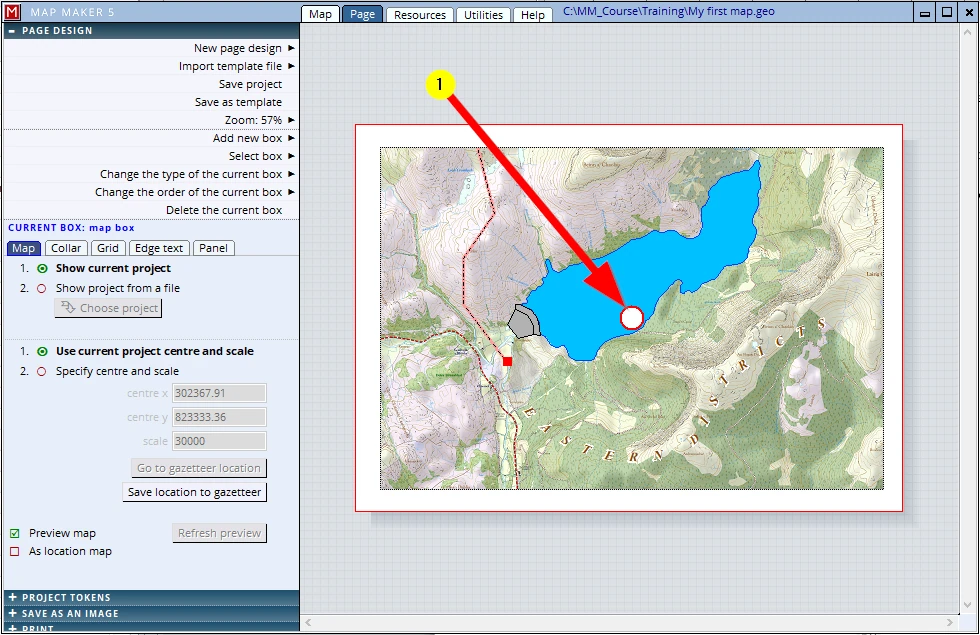
MM5 offers a good choice of options as to what to show in the map box. There are many options an settings we could change to customise the layout . However, at this stage we use the given layout. At his stage the only important thing to know is how to pan the map in this map box / print preview
(1) We can ‘Pan’ the area to be printed through a ‘click, hold and drag’ in the big white centre dot/circle. (If you click, hold and drag outside the white dot you will be moving the entire map box)
Print to paper
To print it on paper:
(1) Go to Page view
(2) Click on the PRINT header (and adjust your printer settings if need be)
(3) Check to see if your printer is he default printer (the blue text above this button) and if not, change it here.
(4) Click on Print
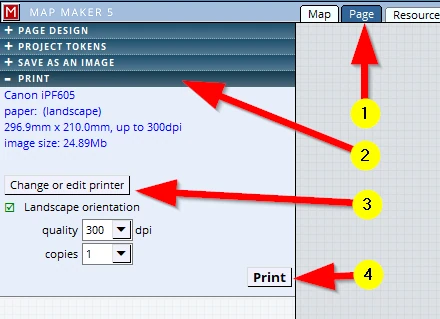
Provided your default printer is on, the map should now roll out of your printer.
Job done.
You have made your first map!
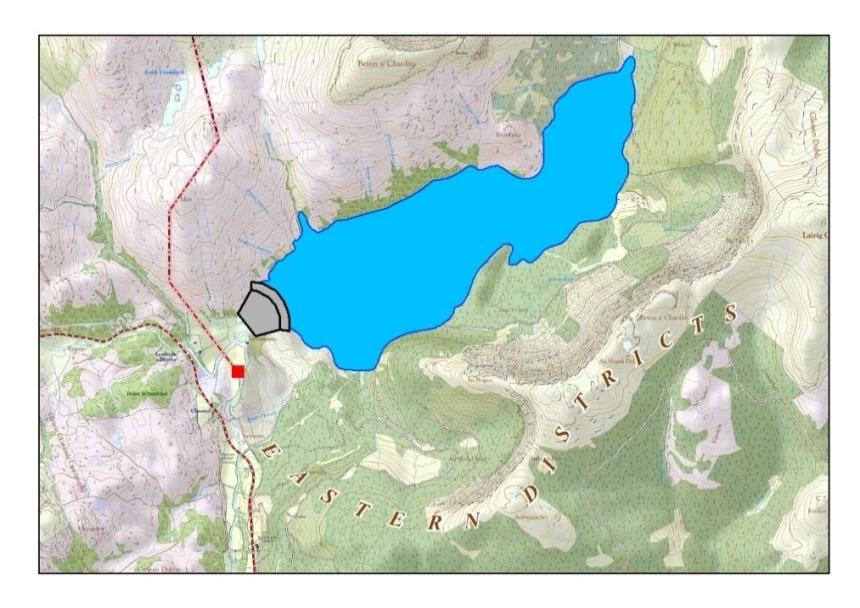
As you can see, it does not yet have the complexity and intricacies of the map as shown on the front page! We will endeavour to do that in the next session.
Save as PDF
We live in a digital age and often we need to email a digital copy.
We can do that too:
(1) Click on the SAVE AS AN IMAGE header
(2) the map will be changed to a ‘raster’ file. This means it will consist of ‘pixels’. The more pixels there are in an image the higher quality it will have. In the printer world this ‘resolution’ is defined by the number of ‘dots per inch’ - ‘dpi’ for short.
The more dots per inch, the sharper the image, but the larger the file size becomes.
This is your call, you need to decide what to put in here.
MM5 makes a suggestion, but you may decide to put in another value.
For a standard high quality print, 300 dpi is a good resolution. If you want to save space in your (or your client’s!) email folder then 150dpi might still be perfectly acceptable.
Just try it and see the relation between file size and quality.
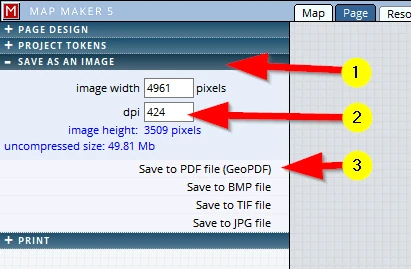
(3) The PDF file is a so-called ‘GeoPDF’. That means the user can open this map in, for example, a mobile phone or some fancy app. It will be registered to the National Grid so that a GPS location point will show exactly right on the map (when the user is in that mapped area).
The other three options are so call ‘raster files’ these will be explained later in the course.
Naturally, when any of these options are activated, you will be asked to save the resultant file somewhere.
Please save it with this name in the training folder:
C:\MM_Course\Training\My First Map_Draft1
Before we close this map, press on F1 to save your project.
We can close the software package by clicking on the black cross top right:
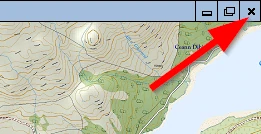
When we have made a change in a project and have not saved it yet and we close the software, MM5 will issue this option menu for you to decide what to do:
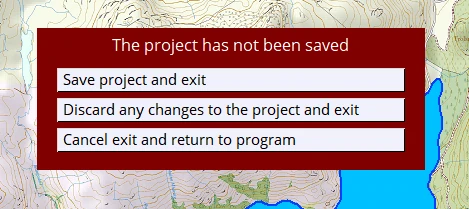
We can also close the current project down by simply starting a new project. This new project can be a completely blank / new project or we open an existing project: